NRDC: Killer Summer Heat - Projected Death Toll from Rising
advertisement

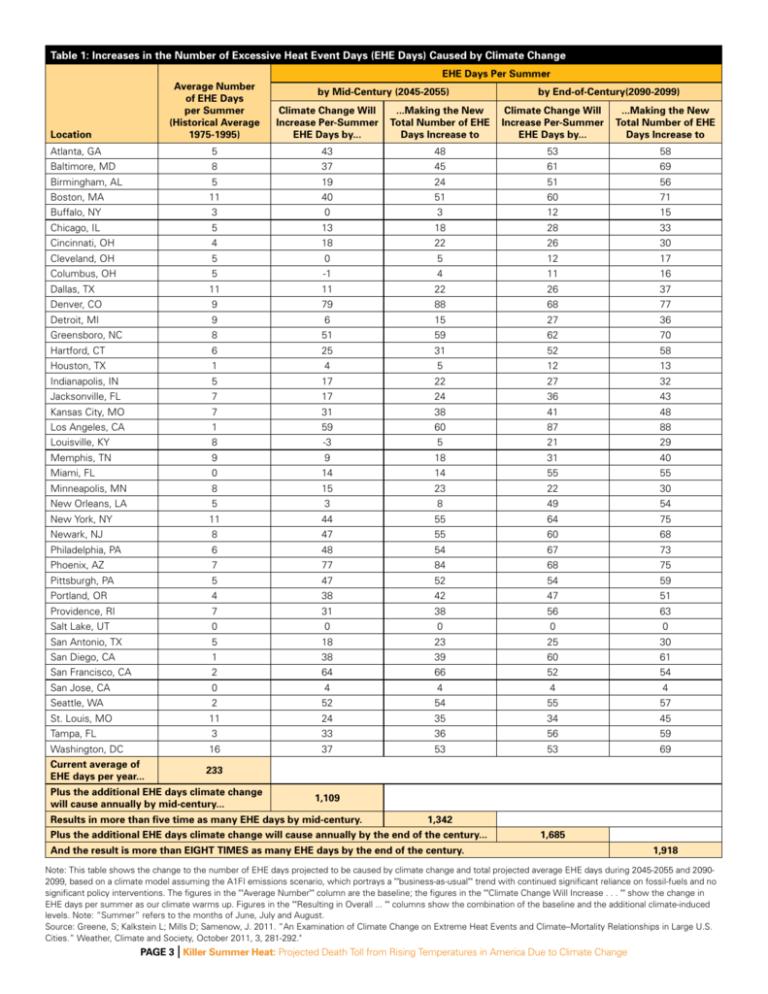
Table 1: Increases in the Number of Excessive Heat Event Days (EHE Days) Caused by Climate Change EHE Days Per Summer Average Number of EHE Days per Summer (Historical Average 1975-1995) Location by Mid-Century (2045-2055) by End-of-Century(2090-2099) Climate Change Will Increase Per-Summer EHE Days by... ...Making the New Total Number of EHE Days Increase to Climate Change Will Increase Per-Summer EHE Days by... ...Making the New Total Number of EHE Days Increase to Atlanta, GA 5 43 48 53 58 Baltimore, MD 8 37 45 61 69 Birmingham, AL 5 19 24 51 56 71 Boston, MA 11 40 51 60 Buffalo, NY 3 0 3 12 15 Chicago, IL 5 13 18 28 33 Cincinnati, OH 4 18 22 26 30 Cleveland, OH 5 0 5 12 17 Columbus, OH 5 -1 4 11 16 Dallas, TX 11 11 22 26 37 Denver, CO 9 79 88 68 77 Detroit, MI 9 6 15 27 36 Greensboro, NC 8 51 59 62 70 Hartford, CT 6 25 31 52 58 Houston, TX 1 4 5 12 13 Indianapolis, IN 5 17 22 27 32 Jacksonville, FL 7 17 24 36 43 Kansas City, MO 7 31 38 41 48 Los Angeles, CA 1 59 60 87 88 Louisville, KY 8 -3 5 21 29 Memphis, TN 9 9 18 31 40 Miami, FL 0 14 14 55 55 Minneapolis, MN 8 15 23 22 30 New Orleans, LA 5 3 8 49 54 New York, NY 11 44 55 64 75 Newark, NJ 8 47 55 60 68 Philadelphia, PA 6 48 54 67 73 Phoenix, AZ 7 77 84 68 75 Pittsburgh, PA 5 47 52 54 59 Portland, OR 4 38 42 47 51 Providence, RI 7 31 38 56 63 Salt Lake, UT 0 0 0 0 0 San Antonio, TX 5 18 23 25 30 San Diego, CA 1 38 39 60 61 San Francisco, CA 2 64 66 52 54 San Jose, CA 0 4 4 4 4 Seattle, WA 2 52 54 55 57 St. Louis, MO 11 24 35 34 45 Tampa, FL 3 33 36 56 59 Washington, DC 16 37 53 53 69 Current average of EHE days per year... 233 Plus the additional EHE days climate change will cause annually by mid-century... 1,109 Results in more than five time as many EHE days by mid-century. 1,342 Plus the additional EHE days climate change will cause annually by the end of the century... 1,685 And the result is more than EIGHT TIMES as many EHE days by the end of the century. 1,918 Note: This table shows the change to the number of EHE days projected to be caused by climate change and total projected average EHE days during 2045-2055 and 20902099, based on a climate model assuming the A1FI emissions scenario, which portrays a ""business-as-usual"" trend with continued significant reliance on fossil-fuels and no significant policy interventions. The figures in the ""Average Number"" column are the baseline; the figures in the ""Climate Change Will Increase . . . "" show the change in EHE days per summer as our climate warms up. Figures in the ""Resulting in Overall ... "" columns show the combination of the baseline and the additional climate-induced levels. Note: “Summer” refers to the months of June, July and August. Source: Greene, S; Kalkstein L; Mills D; Samenow, J. 2011. “An Examination of Climate Change on Extreme Heat Events and Climate–Mortality Relationships in Large U.S. Cities.” Weather, Climate and Society, October 2011, 3, 281-292." | PAGE 3 Killer Summer Heat: Projected Death Toll from Rising Temperatures in America Due to Climate Change New York, USA - June 10, 2011 where the thermometer reached 80+ degrees Table 2: Increases in EHE-Attributable Mortality Caused by Climate Change Mortality Per Summer By Mid-Century (2045-2055) Cumulative Additional Mortality By End-of-Century (2090-2099) By End-ofCentury (2099) Average Mortality per Summer (Historical Average 1975-2004) Climate Change Will Increase Per-Summer Average Mortality by... ...Making the New Total Summertime Mortality Increase to Atlanta, GA 35 -11 24 -6 29 (359) (756) Baltimore, MD 57 26 83 70 127 495 2,947 Birmingham, AL 24 8 32 51 75 103 1,680 Boston, MA 99 55 154 114 213 1,404 5,715 Buffalo, NY 18 33 51 74 92 479 3,190 Chicago, IL 93 49 142 157 250 1,034 6,361 Cincinnati, OH 12 9 21 16 28 245 897 Cleveland, OH 40 93 133 446 486 2,530 16,625 Columbus, OH 4 38 42 151 155 1,066 6,001 Dallas, TX 46 69 115 144 190 1,885 7,271 Denver, CO 48 46 94 35 83 1,551 3,515 Detroit, MI 52 133 185 402 454 4,109 17,877 Greensboro, NC 31 16 47 21 52 331 1,259 Hartford, CT 27 13 40 49 76 283 1,892 Houston, TX 2 14 16 25 27 406 1,391 Indianapolis, IN 23 28 51 50 73 837 2,783 Location | Climate Change Will Increase Per-Summer Average Mortality by... By MidCentury) (2050) ...Making the New Total Summertime Mortality Increase to Year after year of increased mortality due to climate change adds up to... PAGE 4 Killer Summer Heat: Projected Death Toll from Rising Temperatures in America Due to Climate Change Table 2: Increases in EHE-Attributable Mortality Caused by Climate Change Mortality Per Summer By Mid-Century (2045-2055) Cumulative Additional Mortality By End-of-Century (2090-2099) By MidCentury) (2050) By End-ofCentury (2099) Average Mortality per Summer (Historical Average 1975-2004) Climate Change Will Increase Per-Summer Average Mortality by... ...Making the New Total Summertime Mortality Increase to Climate Change Will Increase Per-Summer Average Mortality by... ...Making the New Total Summertime Mortality Increase to Jacksonville, FL 30 81 111 169 199 1,813 8,141 Kansas City, MO 41 48 89 71 112 1,280 4,236 Los Angeles, CA 18 11 29 29 47 219 1,222 Louisville, KY 39 218 257 337 376 5,081 18,988 Memphis, TN 46 84 130 247 293 1,645 10,154 Miami, FL 0 0 0 0 0 0 0 Minneapolis, MN 14 79 93 107 121 2,892 7,516 New Orleans, LA 22 7 29 46 68 221 1,613 New York, NY 184 -2 182 65 249 (573) 1,127 Newark, NJ 56 13 69 30 86 320 1,409 Philadelphia, PA 53 4 57 25 78 (39) 714 Phoenix, AZ 33 11 44 58 91 213 2,021 Pittsburgh, PA 19 14 33 19 38 411 1,241 Location Year after year of increased mortality due to climate change adds up to... Portland, OR 9 8 17 12 21 237 736 Providence, RI 37 16 53 50 87 353 2,035 Salt Lake, UT 2 1 3 2 4 36 113 San Antonio, TX 21 6 27 14 35 98 631 San Diego, CA 0 4 4 7 7 119 396 San Francisco, CA 3 2 5 5 8 87 260 San Jose, CA 10 3 13 5 15 69 281 Seattle, WA 11 -2 9 1 12 (99) (125) St. Louis, MO 24 58 82 113 137 1,285 5,621 Tampa, FL 25 0 25 16 41 (72) 351 Washington, DC 24 33 57 49 73 942 2,994 Current annual average mortality... 1,332 plus the additional annual mortality due to climate change by midcentury... 1,316 results in DOUBLED total EHE-mortality by midcentury: 2,648 By the end of the century the additional burden of climate change on EHE-mortality is even greater compared to current levels . . . Resulting in more than a TRIPLING of EHE-Mortality by the end of the century. 3,276 4,608 By 2050, the additional cumulative heat-related mortality caused by the additive effect of climate change is: 32,934 By 2099, the additional cumulative heat-related mortality caused by the additive effect of climate change is: 150,322 Note: This table shows the additional mortality caused by climate change as well as total EHE mortality by 2050 and 2099 based on a climate model assuming the A1FI emissions scenario, which portrays a "business-as-usual" trend with continued significant reliance on fossil-fuels and no significant policy interventions. It also shows the cumulative impact of the additional mortality that occurs due to the effect of climate change. The figures in the "Average Number" column are the baseline; the figures in the "Climate Change Will Increase . . . " show the change in mortality per summer as our climate warms up. Figures in the "Making a New Summertime Total" show the combination of the baseline and the additional climate-induced levels. Note: “Summer” refers to the months of June, July and August. Sources: Column 2: Kalkstein L., Greene S., Mills D., Samenow S. “An evaluation of the progress in reducing heat-related human mortality in major U.S. cities,” 2010, Natural Hazards. DOI 10.1007/s11069-010-9552-3. Columns 4 and 6: Greene, S; Kalkstein L; Mills D; Samenow, J. 2011. “An Examination of Climate Change on Extreme Heat Events and Climate–Mortality Relationships in Large U.S. Cities.” Weather, Climate and Society, October 2011, 3, 281-292. | PAGE 5 Killer Summer Heat: Projected Death Toll from Rising Temperatures in America Due to Climate Change


