Financial Highlights
advertisement
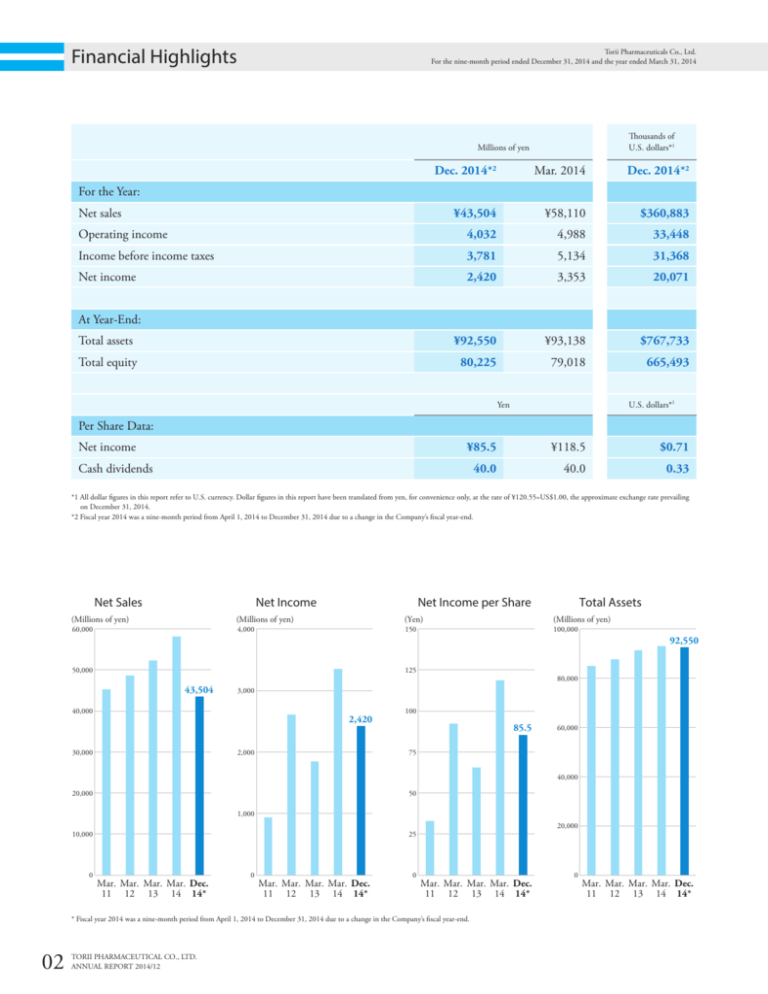
Financial Highlights Torii Pharmaceuticals Co., Ltd. For the nine-month period ended December 31, 2014 and the year ended March 31, 2014 Thousands of U.S. dollars*1 Millions of yen Dec. 2014*2 Mar. 2014 Dec. 2014*2 ¥43,504 ¥58,110 $360,883 Operating income 4,032 4,988 33,448 Income before income taxes 3,781 5,134 31,368 Net income 2,420 3,353 20,071 Total assets ¥92,550 ¥93,138 $767,733 Total equity 80,225 79,018 665,493 For the Year: Net sales At Year-End: Yen U.S. dollars*1 Per Share Data: Net income ¥85.5 ¥118.5 $0.71 40.0 40.0 0.33 Cash dividends *1 All dollar figures in this report refer to U.S. currency. Dollar figures in this report have been translated from yen, for convenience only, at the rate of ¥120.55=US$1.00, the approximate exchange rate prevailing on December 31, 2014. *2 Fiscal year 2014 was a nine-month period from April 1, 2014 to December 31, 2014 due to a change in the Company’s fiscal year-end. Net Sales Net Income (Millions of yen) Net Income per Share (Millions of yen) 60,000 (Yen) 150 4,000 Total Assets (Millions of yen) 100,000 92,550 50,000 125 43,504 40,000 2,420 30,000 80,000 3,000 2,000 100 85.5 60,000 75 40,000 20,000 50 1,000 10,000 0 20,000 25 Mar. Mar. Mar. Mar. Dec. 11 12 13 14 14* 0 Mar. Mar. Mar. Mar. Dec. 11 12 13 14 14* 0 Mar. Mar. Mar. Mar. Dec. 11 12 13 14 14* * Fiscal year 2014 was a nine-month period from April 1, 2014 to December 31, 2014 due to a change in the Company’s fiscal year-end. 02 TORII PHARMACEUTICAL CO., LTD. ANNUAL REPORT 2014/12 0 Mar. Mar. Mar. Mar. Dec. 11 12 13 14 14*


