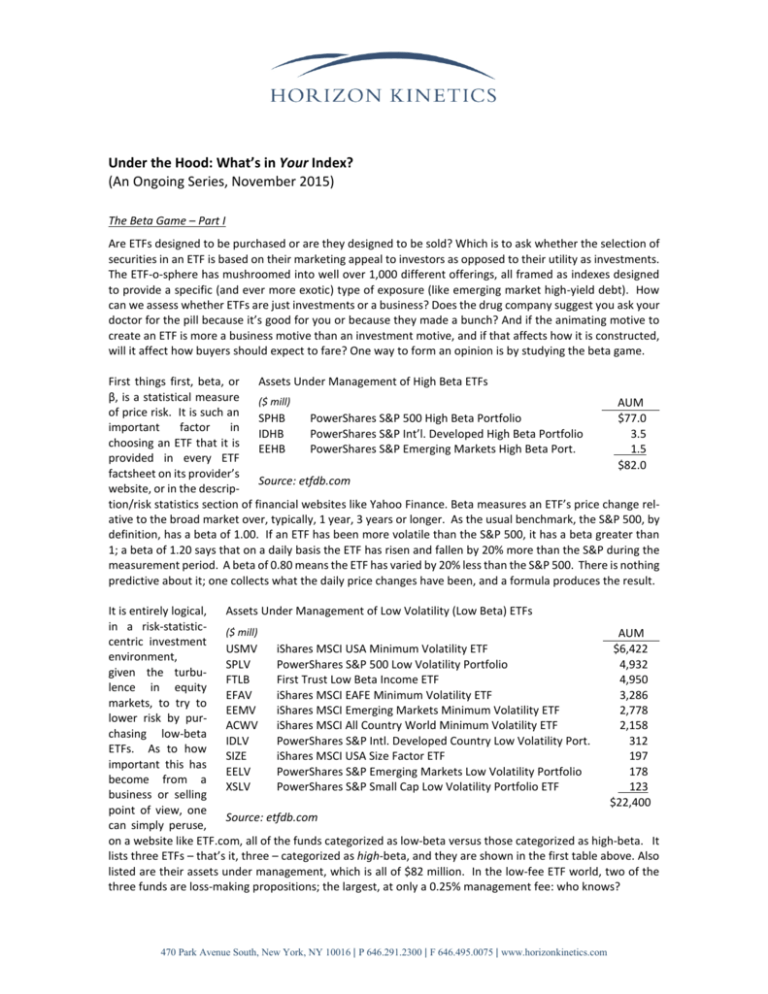
Under the Hood: What’s in Your Index?
(An Ongoing Series, November 2015)
The Beta Game – Part I
Are ETFs designed to be purchased or are they designed to be sold? Which is to ask whether the selection of
securities in an ETF is based on their marketing appeal to investors as opposed to their utility as investments.
The ETF-o-sphere has mushroomed into well over 1,000 different offerings, all framed as indexes designed
to provide a specific (and ever more exotic) type of exposure (like emerging market high-yield debt). How
can we assess whether ETFs are just investments or a business? Does the drug company suggest you ask your
doctor for the pill because it’s good for you or because they made a bunch? And if the animating motive to
create an ETF is more a business motive than an investment motive, and if that affects how it is constructed,
will it affect how buyers should expect to fare? One way to form an opinion is by studying the beta game.
First things first, beta, or
Assets Under Management of High Beta ETFs
β, is a statistical measure
($ mill)
AUM
of price risk. It is such an
SPHB
PowerShares S&P 500 High Beta Portfolio
$77.0
important
factor
in
IDHB
PowerShares S&P Int’l. Developed High Beta Portfolio
3.5
choosing an ETF that it is
EEHB
PowerShares S&P Emerging Markets High Beta Port.
1.5
provided in every ETF
$82.0
factsheet on its provider’s
Source: etfdb.com
website, or in the description/risk statistics section of financial websites like Yahoo Finance. Beta measures an ETF’s price change relative to the broad market over, typically, 1 year, 3 years or longer. As the usual benchmark, the S&P 500, by
definition, has a beta of 1.00. If an ETF has been more volatile than the S&P 500, it has a beta greater than
1; a beta of 1.20 says that on a daily basis the ETF has risen and fallen by 20% more than the S&P during the
measurement period. A beta of 0.80 means the ETF has varied by 20% less than the S&P 500. There is nothing
predictive about it; one collects what the daily price changes have been, and a formula produces the result.
It is entirely logical,
Assets Under Management of Low Volatility (Low Beta) ETFs
in a risk-statistic($ mill)
AUM
centric investment
USMV
iShares MSCI USA Minimum Volatility ETF
$6,422
environment,
SPLV
PowerShares S&P 500 Low Volatility Portfolio
4,932
given the turbuFTLB
First Trust Low Beta Income ETF
4,950
lence in equity
EFAV
iShares MSCI EAFE Minimum Volatility ETF
3,286
markets, to try to
EEMV
iShares MSCI Emerging Markets Minimum Volatility ETF
2,778
lower risk by purACWV iShares MSCI All Country World Minimum Volatility ETF
2,158
chasing low-beta
IDLV
PowerShares S&P Intl. Developed Country Low Volatility Port.
312
ETFs. As to how
SIZE
iShares MSCI USA Size Factor ETF
197
important this has
EELV
PowerShares S&P Emerging Markets Low Volatility Portfolio
178
become from a
XSLV
PowerShares S&P Small Cap Low Volatility Portfolio ETF
123
business or selling
$22,400
point of view, one
Source: etfdb.com
can simply peruse,
on a website like ETF.com, all of the funds categorized as low-beta versus those categorized as high-beta. It
lists three ETFs – that’s it, three – categorized as high-beta, and they are shown in the first table above. Also
listed are their assets under management, which is all of $82 million. In the low-fee ETF world, two of the
three funds are loss-making propositions; the largest, at only a 0.25% management fee: who knows?
470 Park Avenue South, New York, NY 10016 | P 646.291.2300 | F 646.495.0075 | www.horizonkinetics.com
As to the list of low volatility ETFs, only a portion of which appears on the accompanying table, it is quite
extensive. By comparison with the rounding error of $82 million, the largest five have a collective $22 billion
of assets under management. Nor does the list include the currently popular currency hedged ETFs, which
strategy is another means of attaining low volatility, and it doesn’t include another popular group of ETFs:
hedged or volatility response ETFs that mitigate risk by changing equity exposure in response to volatility
signals.
The purpose of the exercise is to demonstrate that there really is no market for a high volatility ETF. Have an
excellent idea for an ETF that should produce high long-term returns from an undervalued, virtually unknown,
but growing group of companies? If it has a beta greater than 1, no one will back you – it won’t be sold.
Now, you might ask, why would anyone want a high-beta ETF anyway? We’ll get to that. But first, one should
understand what happens when a single factor becomes the animating motive for the manufacturer of a
product and, in turn, the impact of the buying power of the investing public upon that product. Here’s where
we play the Beta Game.
Equity Beta of Small Capitalization Indexes, 7/31/2015
There is, on the one hand, academic and statisIWM
iShares Russell 2000 ETF
0.92
tical rigor and, on the other, reality. One might
IWO
iShares Russell 2000 Growth ETF
0.95
believe that small capitalization equities are
IWN
iShares Russell 2000 Value ETF
0.88
more volatile than large company stocks. HowSource: iShares
ever, the available data does not substantiate
this view. Consider the betas of some small capitalization iShares Russell indexes: the iShares Russell 2000
ETF, the iShares Russell 2000 Growth ETF, and the iShares Russell 2000 Value ETF. All have betas well less
than the S&P, no matter if they’re growth or value. Essentially, ETFs that receive consistent cash inflow will
exhibit low volatility (it’s tough for the price of anything to go down if, mostly, people are buying it). If it
exhibits low volatility, naturally it will receive cash flow. Thus, computer enabled circular logic prevails.
Beta for iShares Biotech ETF
Here’s a stronger example. It is beyond dispute, even by the
3-Year Beta 5-Year Beta 10-Year Beta
academic/investment professional community, much less the
average newspaper reader, that biotechnology companies are
0.98
0.76
0.67
Calculated through 8/31/15.
riskier as businesses than the average: they have greater product development risk and expense, regulatory approval risk,
product obsolescence risk, funding risk and, of course, valuation risk since they tend to be priced like lottery
tickets on any good news. So, with the market having a beta of 1.0, what is the beta of the iShares Biotech
ETF. Well, it was a lot lower than the S&P 500, at least through August 31st.
That’s the statistical reality, but is it reliable reality? 1 If one
Annual Net Asset Flows for IBB, in $ millions
looks at how much net money was flooding into this ETF in
1/1/15 –
2012
2013
2014
9/30/15
recent years, with the ETF buying ever more shares of the
same companies, the low beta makes sense. Not sense from
$287
$747
$994
$1,383
the perspective of business risk or company valuation, but
Source: ETF.com
sense in that we know investors were buying this ETF like
mad: $280 million in 2012, then $750 million, then $1 billion, then $1.4 billion.
Let’s go a little farther afield – literally. This next is a list of some of our favorites. One ETF on the list, the
iShares MSCI Frontier 100, may not be familiar to many. It has a negative 14.4% year-to-date return. It has
In the last couple of months, prominent news of price gouging, and in a political season, caused sharp price drops in
many drug sector stocks. IBB has since underperformed the S&P 500, its 3-year Beta, through October 30th, is now 1.03,
and in the 4 weeks ended November 11th, it had over $400 million of outflow.
1
470 Park Avenue South, New York, NY 10016 | P 646.291.2300 | F 646.495.0075 | www.horizonkinetics.com
26.3% exposure in Kuwait, 14.6% in Nigeria (the home of Boko Haram), 11.2% in Argentina, and 10.4% in
Pakistan. Knowing this, no one would ridicule you for thinking the beta should be 2 – or 3 – or more. But it is
0.4. It is dramatically safer, by this measure, than the S&P 500 Index. If you really, really believe in the
statistics by which advisors allocate capital, and you’re really worried about the impact of higher interest
rates in the U.S., take your money and invest it in the Frontier 100. It is, by definition and mathematics, safer.
Year to date, the Turkish ETF is down 30.7%. Some
would assert that is evidence of some volatility;
however, the beta is 0.81. The iShares China
Large-Cap ETF has a 0.98 beta. The iShares MSCI
India Large-Cap ETF has a beta of 0.64 and the
iShares MSCI India Small-Cap ETF has a 0.81 beta.
Betas as of August 31, 2015
IWC
FM
TUR
FXI
INDA
SMIN
iShares Micro-Cap ETF
iShares MSCI Frontier 100 ETF
iShares MSCI Turkey ETF
iShares China Large-Cap ETF
iShares MSCI India ETF
iShares MSCI India Small-Cap ETF
Essentially, any portfolio with a high beta in the
Source: iShares
post 2008 to 2009 environment is unmarketable.
Consequently, high beta portfolios are rapidly becoming extinct in the investment world.
0.79
0.40
0.81
0.98
0.64
0.81
Subsequent to the 2008/2009 period, the vast cash flow into the indices that are comprised of low beta equities is probably a contributive factor to their success. However, sooner or later even these indices will experience episodes of volatility that will serve to raise their betas above 1. In that case, by the peculiar logic of
modern portfolio theory, the asset allocators will be compelled to own fewer of these types of securities. Of
course, one might be inclined to reject this proposition, but that would imply that one believes that virtually
every asset class has, and will maintain, a lower beta than the S&P 500.
Now, there are some questions still to answer, such as how can a volatile asset have a low beta, and why
would an investor have an interest (and it might be a very good idea, actually) in a high-beta security? And
there is some fun to have with constructing the lowest beta portfolio around (which we have done). These
will be addressed in Part II.
Disclosures:
Past performance is not indicative of future results. This information should not be used as a general guide
to investing or as a source of any specific investment recommendations. This is not an offer to sell or a solicitation to invest. Opinions and estimates offered constitute the judgment of Horizon Kinetics LLC (“Horizon
Kinetics”) and are subject to change without notice, as are statements of financial market trends, which are
based on current market conditions. Under no circumstances does the information contained within represent
a recommendation to buy, hold or sell any security, and it should not be assumed that the securities transactions or holdings discussed were or will prove to be profitable.
Subsidiaries of Horizon Kinetics LLC manage separate accounts and pooled products that may hold certain of
the securities mentioned herein. For more information on Horizon Kinetics, you may visit our website at
www.horizonkinetics.com. No part of the research analysts’ compensation was, is, or will be, directly or indirectly, related to the specific recommendations or views expressed by the research analysts in the research
report.
All material presented is compiled from sources believed to be reliable, but no guarantee is given as to its
accuracy. No part of this material may be: a) copied, photocopied, or duplicated in any form, by any means;
or b) redistributed without Horizon Kinetics’ prior written consent.
©2015 Horizon Kinetics LLC ® All rights reserved.
470 Park Avenue South, New York, NY 10016 | P 646.291.2300 | F 646.495.0075 | www.horizonkinetics.com

