AP Statistics – Chapter 4 Test Review
advertisement
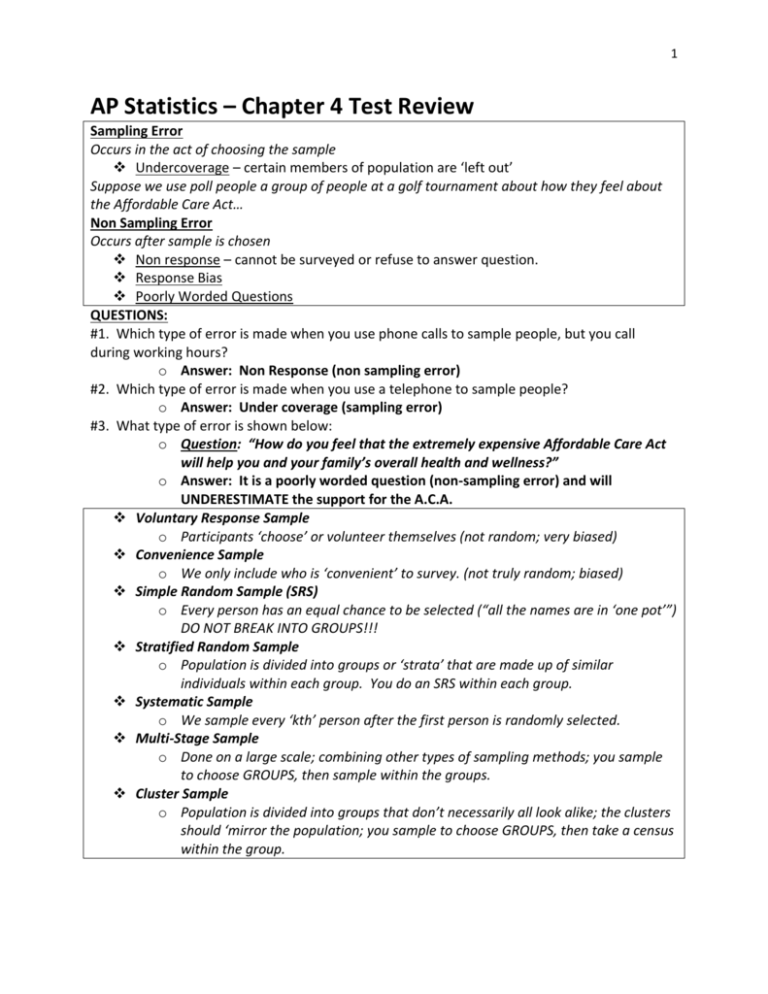
1 AP Statistics – Chapter 4 Test Review Sampling Error Occurs in the act of choosing the sample Undercoverage – certain members of population are ‘left out’ Suppose we use poll people a group of people at a golf tournament about how they feel about the Affordable Care Act… Non Sampling Error Occurs after sample is chosen Non response – cannot be surveyed or refuse to answer question. Response Bias Poorly Worded Questions QUESTIONS: #1. Which type of error is made when you use phone calls to sample people, but you call during working hours? o Answer: Non Response (non sampling error) #2. Which type of error is made when you use a telephone to sample people? o Answer: Under coverage (sampling error) #3. What type of error is shown below: o Question: “How do you feel that the extremely expensive Affordable Care Act will help you and your family’s overall health and wellness?” o Answer: It is a poorly worded question (non-sampling error) and will UNDERESTIMATE the support for the A.C.A. Voluntary Response Sample o Participants ‘choose’ or volunteer themselves (not random; very biased) Convenience Sample o We only include who is ‘convenient’ to survey. (not truly random; biased) Simple Random Sample (SRS) o Every person has an equal chance to be selected (“all the names are in ‘one pot’”) DO NOT BREAK INTO GROUPS!!! Stratified Random Sample o Population is divided into groups or ‘strata’ that are made up of similar individuals within each group. You do an SRS within each group. Systematic Sample o We sample every ‘kth’ person after the first person is randomly selected. Multi-Stage Sample o Done on a large scale; combining other types of sampling methods; you sample to choose GROUPS, then sample within the groups. Cluster Sample o Population is divided into groups that don’t necessarily all look alike; the clusters should ‘mirror the population; you sample to choose GROUPS, then take a census within the group. 2 #4. Simple Random Samples (“chopping through #’s) ◦ Labels 9 people? ◦ 1 digit 10 people? ◦ 1 digit 100 people? ◦ 2 digits 57 people? ◦ 2 digits 1000 people? ◦ 3 digits 124 people? ◦ 2 digits #5. You have two dogs, each of whom have a litter of 12 puppies. You want to determine the amount of weight gain over 12 weeks based on the type of food that you give them. If you give puppy food #1 to one dog’s 12 puppies and puppy food #2 to the other dog’s 12 puppies and then compare the weight gain after 12 weeks, what type of experiment have you carried out? ◦ Answer: An experiment, but NOT completely randomized #6. Puppies… continued… Suppose you now give puppy food #1 to an SRS of 6 puppies from one ‘momma dog’ and an SRS of 6 puppies from the other ‘momma dog’, with the remaining 12 puppies from the two ‘momma dogs’, then what type of design have you used now? ◦ Answer: Block Design, based on which ‘momma dog’ Explain Double-blind experiments …. Single-blind… Be able to identify what these types of experiments look like and why we prefer to using ‘blinding’ in certain instances… #7. Suppose that you decide to do a survey in Somerset to inquire about a ‘particular issue’. You decide to select an SRS of 50 homes in the city limits and you contact them for a face-to-face interview that consists of 2 questions. What is the chance that all 50 homes just happened to be drawn from the same neighborhood (Oaklawn)? ◦ Answer: the same chance as for any other set of 50 homes…. #8. You wish to do a survey of residents in the state of Tennessee. You select an SRS of 100 adults heads of households in each county (broken down into region: East TN, Middle TN, and West TN) in the state and ask their opinion on the selected topic. What type of sample is this? ◦ Answer: Stratified 3 #9. Does the amount of sales of ice cream (in dollars) accurately predict the number of drowning's in Lake Michigan? Does ice cream CAUSE drowning’s? Consider what conclusion can be drawn? Answer: Lurking/confounding variable – seasonal variation in temperature… hotter it is, more ice cream consumed…. More people swim…. Thus, more drowning’s… #10. An experiment will take place at Kroger, in which participants will taste test each of two kinds of sweet tea. What type of design is this? o Answer: Matched Pairs #11. I choose to do a survey at Somerset High School. I randomly select 2 homerooms per grade and ask every student in those homerooms the selected question. What type of sample is this? o Answer: Cluster… (sample, then census) #12. I decide to do a large-scale sample using Gallup. I want to gather information about feelings about a potential major candidate for the U.S. presidency. I then select 10 states, and then within those 10 states, I select 2 AREA CODES and then select 200 people randomly from those AREA CODES to be a part of the survey… What type of sample is this? o ANSWER: Multi-stage #13. I decide to do a survey at the University of Alabama. I decide to divide the student population into groups based on the following criteria o In-state and in what 5 different regions from Alabama they are from o Out-of-state o I will then do random samples within each of the 6 groups. o What type of sample have I done? o ANSWER: Stratified #14. Why is doing an SRS of 100 people preferable to doing an SRS of just 10 people? o Answer: To improve the overall accuracy of the survey/sample results. It also helps to reduce variation/variability in the results. #15. MULTIPLE CHOICE: In the late 1990’s Scotland was considering independence from England. An opinion poll showed that 51% of Scots favor "independence." Another poll taken at the same time showed that only 34% favored being "separate" from England. The reason these results differ by so much is that A. samples will usually differ just by chance due to random sampling. B. the wording of questions has a big effect on poll results. C. more follow-up efforts reduced the nonresponse rate of the second poll. D. the sample sizes are different, so the margins of error are different. E. the second poll suffered from under coverage. 4 Sample Design Review: Classify each survey/sample design as either: (Census, Voluntary Response, Convenience, Simple Random (SRS), Systematic, Stratified, Multi-State or Cluster). #1. To conduct a pre-election opinion poll on the latest school board election, samples of 5 households from each telephone prefix (first three digits of the phone numbers) in the voting district were called. #2. To conduct a study on depression among the elderly, a sample of 30 patients in one nursing home was used. #3. Subscribers to the magazine Sound Alive were assigned numbers. Then a sample of 30 subscribers was selected by using a random number table. The subscribers in the sample were invited to rate new compact disc players for a “What a Subscribers Think” column. th #4. To maintain quality control in a brewery, every 20 bottle of beer coming off the production line was opened and tested. #5. To judge the appeal of a proposed television sitcom, a random sample of 10 people from each of three different age categories were selected and those chose were asked to rate a pilot show. #6. Obtain a list of patients discharged from all MMH facilities. Divide the patients according to length of hospital stay (3 days or less, 3-7 days, 8-14 days, more than 14 days). Draw simple random samples from each group. #7. Obtain lists of patients discharged from all MMH facilities. Number these patients, and then use a random number table to obtain the sample. #8. Randomly select some MMH facilities from each of five geographic regions, and then take random samples from each of these hospital discharge lists. th #9. At the beginning of the year, instruct each MMH facility to survey every 500 patient discharged. #10. Randomly selected some MMH facilities and from each of the facilities, ask every person from a discharge list their satisfaction level. 5 #11. Instruct each MMH facility to survey 10 discharged patients this week and send in the results. #12. Assign each business in the Island Business Directory a number and then use a random number table to select the businesses to be included in the sample. #13. Send a team of five research assistants to Bishop Street in downtown Honolulu. Let each assistant select a block or building and interview an employee from each business found. Each researcher can have the rest of the day off after getting responses from 20 different businesses. #14. Use the postal ZIP Codes to divide the state into regions. Pick a random sample of 10 ZIP Codes areas and then pick a random sample of 10 businesses in each ZIP Code area. #15. A radio call-in show invites fans of the Louisville Cardinals to provide their input on the team’s last performance in football. #16. A restaurant has survey forms provided for customers to take, fill out and mail back in regarding their satisfaction in the restaurant. #17. Use the Island Business Directory. Number all the businesses. Select a stating place at random, and then use every 50th business listed until you have 100 businesses. #18. Group the businesses according to type: medical, shipping, retain, manufacturing, financial, construction, restaurant, hotel, tourism, other. Then select a random sample of 10 businesses from each business type. #19. You randomly selected several city blocks and survey EVERY business located within that city block. #20. A teacher needs to know their 4th period class’s opinion of the last test the class took. The teacher has every student fill out a survey and turn it in before the end of class. #21. A teacher needs to know their six class’s opinion of the last test the classes took. The teacher randomly selects 3 of the 6 classes and has every student fill out a survey and turn it in before the end of class. #22. A marine biologist wants to estimate the mean size of the barnacle Semibalanus balnoides on a stretch of rocky shoreline. To do so, he randomly selected twenty 10-cm. square plots and measured the size of every barnacle in each plot. #23. To determine the proportion of each color of Peanut Butter M&M, you buy 10 1.69 ounce packages and count how many there are of each color. 6 “Dewey Defeats Truman!” This headline on November 3, 1948 appeared in newspapers all over the world. Unfortunately for the public opinion pollsters and journalists, the headline turned out to be wrong. Truman was elected president in 1948. This false conclusion was based on polls that were taken before the election. The Gallup Poll gave Dewey 49.5% of the votes, Truman 44.5% of the votes and other candidates 6%. The actual vote gave Truman 28 states and Dewey 16 states. Using your knowledge of sampling and statistics, analyze how these disastrous predictions may have come about. 2006 AP Statistics Exam Free-Response #5 A biologist is interested in studying the effect of growth-enhancing nutrients and different salinity (salt) levels in water on the growth of shrimps. The biologist has ordered a large shipment of young tiger shrimps from a supply house for use in the study. The experiment is to be conducted in a laboratory where 10 tiger shrimps are placed randomly into each of 12 similar tanks in a controlled environment. The biologist is planning to use 3 different growthenhancing nutrients (A, B, and C) and two different salinity levels (low and high). a. List the treatments that the biologist plans to use in this experiment. b. Using the treatments listed in part (a), describe a completely randomized design that will allow the biologist to compare the shrimps’ growth after 3 weeks. c. Give one statistical advantage to having only tiger shrimps in the experiment. Explain why this is an advantage. d. Give one statistical disadvantage to having only tiger shrimps in the experiment. Explain why this is a disadvantage.
