Chapter 46 Ecosystems and Global Ecology
advertisement
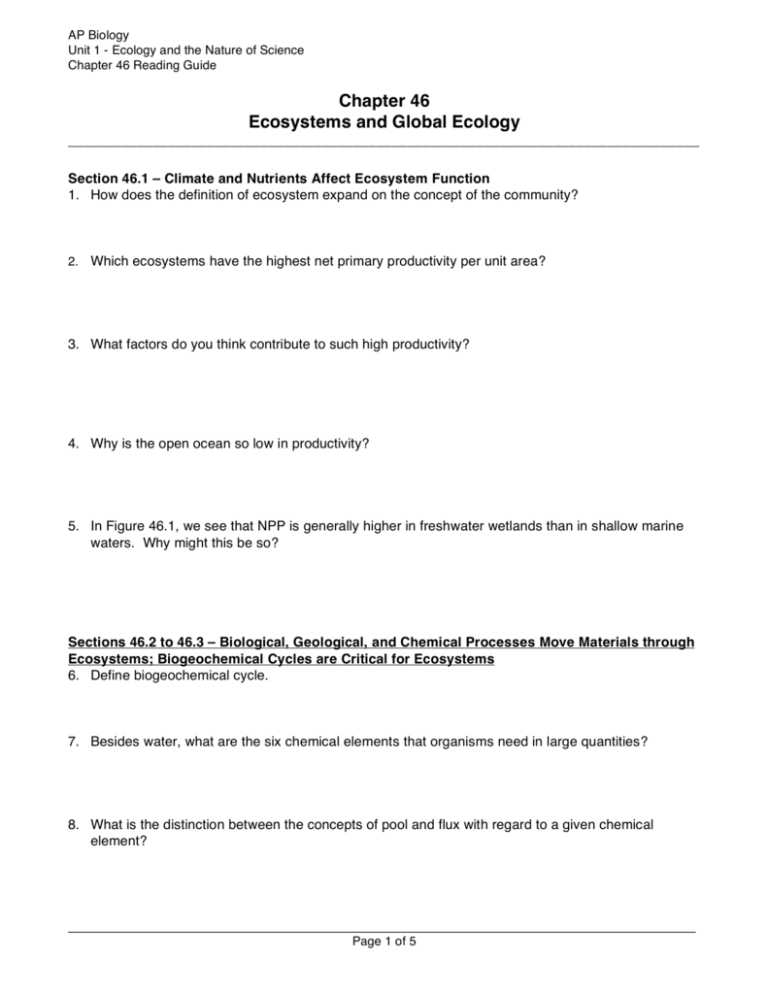
AP Biology Unit 1 - Ecology and the Nature of Science Chapter 46 Reading Guide Chapter 46 Ecosystems and Global Ecology __________________________________________________________________________________ Section 46.1 – Climate and Nutrients Affect Ecosystem Function 1. How does the definition of ecosystem expand on the concept of the community? 2. Which ecosystems have the highest net primary productivity per unit area? 3. What factors do you think contribute to such high productivity? 4. Why is the open ocean so low in productivity? 5. In Figure 46.1, we see that NPP is generally higher in freshwater wetlands than in shallow marine waters. Why might this be so? Sections 46.2 to 46.3 – Biological, Geological, and Chemical Processes Move Materials through Ecosystems; Biogeochemical Cycles are Critical for Ecosystems 6. Define biogeochemical cycle. 7. Besides water, what are the six chemical elements that organisms need in large quantities? 8. What is the distinction between the concepts of pool and flux with regard to a given chemical element? __________________________________________________________________________________________ Page 1 of 5 AP Biology Unit 1 - Ecology and the Nature of Science Chapter 46 Reading Guide 9. Explain the statement that energy flows through ecosystems whereas materials cycle within ecosystems. 10. Describe/diagram the hydrologic cycle. 11. What are the major processes that move carbon through the ecosystem? What percentage of the flux of carbon from terrestrial ecosystems into the atmosphere is due to human activities? 12. Explain why rates of outgassing of CO2 from oceans and fresh waters are lower than rates of its dissolution in those waters. 13. Why is nitrogen often a limiting nutrient for plant growth, even though it is the most abundant element in Earth’s atmosphere? 14. Identify the role of each of the following in the nitrogen cycle: a. Nitrogen fixation b. Denitrification __________________________________________________________________________________________ Page 2 of 5 AP Biology Unit 1 - Ecology and the Nature of Science Chapter 46 Reading Guide 15. Define eutrophication. What two chemical elements are the greatest contributors to eutrophication of aquatic ecosystems? Why is it a problem? 16. The figure below shows the productivity in relation to certain environmental factors in a marine ecosystem in the North Sea. a. What environmental factor has most influence on producer increases during February? b. Account for the smaller outburst in productivity that takes place in the late summer. c. Draw on the graph the curve that would best indicate the biomass of the secondary consumers. __________________________________________________________________________________________ Page 3 of 5 AP Biology Unit 1 - Ecology and the Nature of Science Chapter 46 Reading Guide d. An inspection of the areas under the curves indicates that the biomass ratio between producers and primary consumers is of the order of 1.4 to 1. i. In what way does this ratio differ from that which would be expected from a terrestrial ecosystem such as a field or a forest? ii. Suggest two reasons for the difference. e. If the above data had been collected for a sea area in the tropics where light and temperature do not change significantly, predict two effects on the standing biomass of producers throughout the year. __________________________________________________________________________________________ Page 4 of 5 AP Biology Unit 1 - Ecology and the Nature of Science Chapter 46 Reading Guide 17. Domestic sewage is rich in saprotrophic bacteria and in organic material, which is readily decomposed. When such sewage is discharged into a river it causes a number of chemical and biotic changes for some distance downstream from the ‘outfall’, i.e., the point at which it enters the river. Typical changes are shown graphically in the figures below. Figure A deals with chemical changes, indicating the amounts of various materials present in the river above the outfall and at various distances downstream from the outfall. Figure B shows the changes in abundance of some of the biotic components over the same stretch of river. Give reasoned explanation for the changes expressed by the curves, relating them to each other where possible. __________________________________________________________________________________________ Page 5 of 5

