Test 7A AP Statistics Name:
advertisement
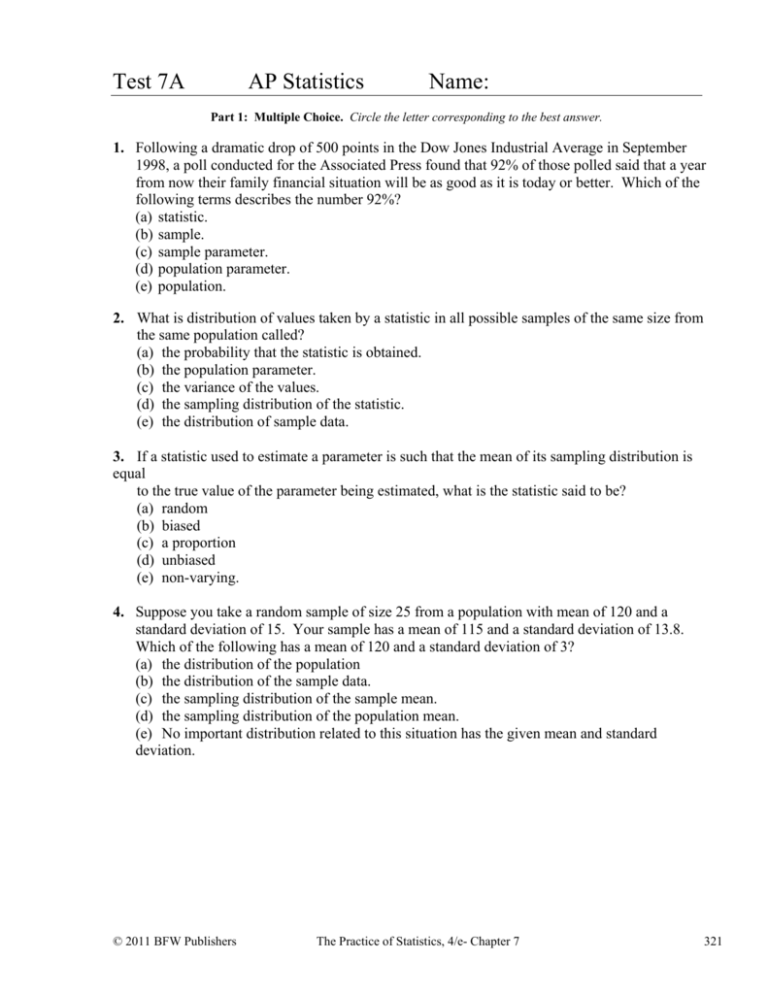
Test 7A AP Statistics Name: Part 1: Multiple Choice. Circle the letter corresponding to the best answer. 1. Following a dramatic drop of 500 points in the Dow Jones Industrial Average in September 1998, a poll conducted for the Associated Press found that 92% of those polled said that a year from now their family financial situation will be as good as it is today or better. Which of the following terms describes the number 92%? (a) statistic. (b) sample. (c) sample parameter. (d) population parameter. (e) population. 2. What is distribution of values taken by a statistic in all possible samples of the same size from the same population called? (a) the probability that the statistic is obtained. (b) the population parameter. (c) the variance of the values. (d) the sampling distribution of the statistic. (e) the distribution of sample data. 3. If a statistic used to estimate a parameter is such that the mean of its sampling distribution is equal to the true value of the parameter being estimated, what is the statistic said to be? (a) random (b) biased (c) a proportion (d) unbiased (e) non-varying. 4. Suppose you take a random sample of size 25 from a population with mean of 120 and a standard deviation of 15. Your sample has a mean of 115 and a standard deviation of 13.8. Which of the following has a mean of 120 and a standard deviation of 3? (a) the distribution of the population (b) the distribution of the sample data. (c) the sampling distribution of the sample mean. (d) the sampling distribution of the population mean. (e) No important distribution related to this situation has the given mean and standard deviation. © 2011 BFW Publishers The Practice of Statistics, 4/e- Chapter 7 321 In order to use the formula X to calculate the standard deviation of the sampling n distribution of the sample mean, which of the following conditions must be met? 5. I. n 30 II. The population’s distribution is approximately Normal. III. The sample size is less than 10% of the population size. (a) (b) (c) (d) (e) I only II only III only III and either I or II All three conditions must be met. 6. The central limit theorem refers to which of the following characteristic of the sampling distribution of the sample mean? (a) Regardless of the shape of the population’s distribution, the sampling distribution of the sample mean from sufficiently large samples will be approximately Normally distributed. (b) Regardless of the shape of the population’s distribution, the standard deviation of the sampling distribution of the sample mean from sufficiently large samples will be n . (c) Regardless of the shape of the population’s distribution, the mean of the sampling distribution of the sample mean from sufficiently large samples will be equal to the mean of the population. (d) As you take larger and larger samples from a Normally distributed population, the standard deviation of the sampling distribution of the sample mean gets smaller and smaller. (e) As you take larger and larger samples from a Normally distributed population, the mean of the sampling distribution of the sample mean gets closer and closer to the population mean. 7. A simple random sample of 1000 Americans found that 62% were satisfied with the service provided by the dealer from which they bought their car. A simple random sample of 1000 Canadians found that 59% were satisfied with the service provided by the dealer from which they bought their car. The sampling variability associated with these statistics is (a) exactly the same. (b) not exactly the same, but very close. (c) much smaller for the sample of Canadians because the population of Canada is much smaller than that of the United States, hence the sample is a larger proportion of the population. (d) smaller for the sample of Canadians because the percent satisfied was smaller than that for the Americans. (e) larger for the Canadians because Canadian citizens are more widely dispersed throughout the country than are citizens in the United States, hence they have more variable views. 322 The Practice of Statistics, 4/e- Chapter 7 © 2011 BFW Publishers 8. A student investigating study habits asks a simple random sample of 16 students at her school how many minutes they spent on their English homework the previous night. Suppose the actual parameter values for this variable are 45 minutes and 15 minutes. Which of the following best describes what we know about the sampling distribution of means for the student’s sample? (a) x 45; x unknown; shape of distribution unknown (b) x 45; x 15; distribution approximately Normal (c) x 45; x 15; shape of distribution unknown (d) x 45; x 3.75; distribution approximately Normal (e) x 45; x 3.75; shape of distribution unknown 9. Olive weights are classified according to a unique set of adjectives implying great size. For example, the mean weight of olives classified as “Colossal” is 7.7 gm. Suppose a particular company’s crop of “Colossal” olives is approximately Normally distributed with a mean of 7.7 gm and a standard deviation of 0.2 gm. Which of the following represents the probability that the mean weight of a random sample of 3 olives from this population is greater than 8 gm? 8 7.7 7.7 8 8 7.7 (a) P z (b) P z (c) P z 0.2 0.2 0.2 3 3 3 8 7.7 8 7.7 (d) P z (e) P z 0.2 0.8 0.2 0.8 3 3 10. In a large population, 46% of the households own DVD recorders. A simple random sample of 100 households from this population is to be contacted and the sample proportion computed. Which of the following expressions represents the probability that more than half the households sampled will own a DVD recorder? 0.46 0.5 0.46 0.5 0.5 0.46 (a) P z (b) P z (c) P z 0.46 0.54 100 0.5 0.5 0.5 0.5 100 100 0.46 0.5 0.5 0.46 (e) P z (d) P z 0.46 0.54 0.46 0.54 100 100 © 2011 BFW Publishers The Practice of Statistics, 4/e- Chapter 7 323 Part 2: Free Response Show all your work. Indicate clearly the methods you use, because you will be graded on the correctness of your methods as well as on the accuracy and completeness of your results and explanations. 11. A study of college freshmen’s study habits found that the time (in hours) that freshmen use to study each week follows a distribution with a mean of 7.2 hours and a standard deviation of 5.3 hours. (a) Can you calculate the probability that a randomly chosen freshman studies more than 9 hours? If so, do it. If not, explain why not. (b) What is the shape of the sampling distribution of the mean x for samples of 55 randomly selected freshmen? Justify your answer. (c) What are the mean and standard deviation for the mean number of hours x spent studying by an SRS of 55 freshmen? (d) Find the probability that the average number of hours spent studying by an SRS of 55 students is greater than 9 hours. Show your work. 324 The Practice of Statistics, 4/e- Chapter 7 © 2011 BFW Publishers 12. A friend has offered to play a gambling game with you that involves flipping a coin that he has provided. Since a flip of heads will be to his advantage, you want to test the coin for fairness before you begin to play. Your friend is willing to let you flip the coin 50 times to determine if the probability of getting heads is actually 0.50, as it should be if the coin is fair. (a) Assume for the moment that the coin is fair. If p̂ is the proportion of heads in 50 flips of the coin, what are the mean and standard deviation of the sampling distribution of p̂ ? (b) Explain why you can use the formula for the standard deviation of p̂ in this setting. (c) You flip the coin 50 times and get 30 heads. Do you risk insulting your friend by refusing to play with his coin? Support your answer with an appropriate probability calculation. © 2011 BFW Publishers The Practice of Statistics, 4/e- Chapter 7 325 13. Teenagers send many text messages—recent polls cite medians of more than 50 per day. Consider a large population of teenagers for whom the distribution of the number of text messages sent per day is strongly skewed to the right. Here is the five-number summary for number of texts per day for this population: Minimum = 0 Quartile 1 = 20 Median = 55 Quartile 3 = 140 Maximum = 250 Suppose we take random samples of size 32 from this population and calculate Q1 for each of our samples. Below is a dotplot of Q1 from 50 such samples. (a) Briefly explain what the dot at 35 represents. (b) Is the sample Q1 an unbiased estimator of the population Q1? Justify your answer. 326 The Practice of Statistics, 4/e- Chapter 7 © 2011 BFW Publishers


