PDF Slides
advertisement
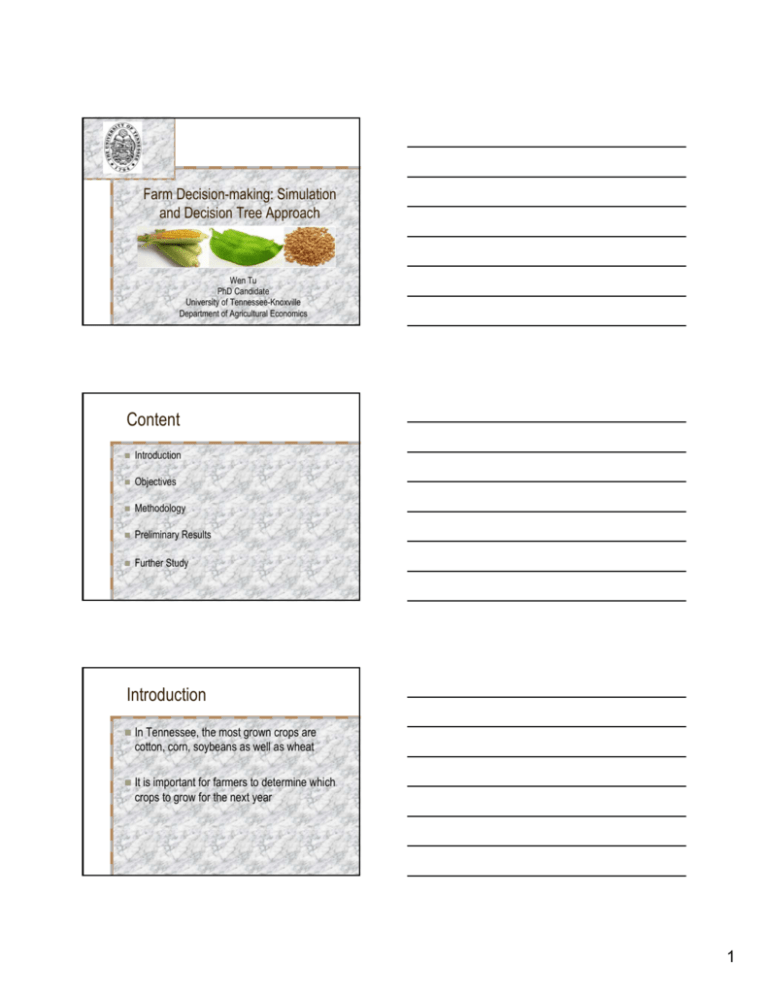
Farm Decision-making: Simulation and Decision Tree Approach Wen Tu PhD Candidate University of Tennessee-Knoxville Department of Agricultural Economics Content Introduction Objectives Methodology Preliminary Results Further Study Introduction In Tennessee, the most grown crops are cotton, corn, soybeans as well as wheat It is important for farmers to determine which crops to grow for the next year 1 Because of the uncertainty of soil condition and weather condition, it is hard to estimate the total yield of the crop for the next year Tennessee Data - Sorghum Planted, Harvested, Yield Commodity Year State Planted All Purposes Harvested Yield Sorghum For Grain 2001 Tennessee 25 thousand acres 22 thousand acres 80 bushel Sorghum For Grain 2002 Tennessee 30 thousand acres 26 thousand acres 80 bushel Sorghum For Grain 2003 Tennessee 45 thousand acres 40 thousand acres 82 bushel Sorghum For Grain 2004 Tennessee 20 thousand acres 17 thousand acres 90 bushel Sorghum For Grain 2005 Tennessee 22 thousand acres 20 thousand acres 92 bushel Sorghum For Grain 2006 Tennessee 14 thousand acres 11 thousand acres 95 bushel Sorghum For Grain 2007 Tennessee 22 thousand acres 19 thousand acres 70 bushel It will help to make decision of which crop to grow if the farmers can know some information about crop yields Simulation is particularly valuable when there is significant uncertainty regarding the outcome or consequences of a particular alternative under consideration 2 One of the computer-based simulation model- ALMANAC- will be used in this study The ALMANAC model can help to simulate the yields of some kinds of crops, as well as the biomass generated by that crop Biomass – Biomass refers to living and recently dead biological material that can be used as fuel or for industrial production – Most commonly, biomass refers to plant matter grown for use as biofuel In this study, we will consider to grow corn, soybean, and wheat on dunmore and dewey soil in Monroe county in Tennessee 3 Objectives The objectives of this study are: – Simulate the crops yield using ALMANAC model, and get the possible distribution of the yield – Based on the simulation results, use decision tree method to decide which crop to grow – Also, consider about the biomass that can be generated by growing corn and wheat, add them to the decision tree to make the final decision more accurate Methodology Model description – The ALMANAC (Agricultural Land Management Alternative with Numerical Assessment Criteria) – In order to improve crops simulation by ALMANAC, some data such as operation dates, fertilizers applied, and crop densities are used to simulate the yield Soil Type: – Dunmore and Dewey Weather – Weather date from Athens Weather Station (LATT = 35.43, LONG = 84.58) Crops: – Corn – Soybean – Wheat 4 Input data for ALMANAC Crop Density (plants/m2) fertilizer date N P2O5 K2O kg/ha kg/ha kg/ha Plant Date Harvest Date Corn 6 (4/22) 190.4 78.4 78.4 (5/1) (10/1) Soybean s 32 (5/7) 0 22.4 44.8 (5/15) (10/1) Wheat 400 (9/22) 89.6 44.8 22.4 (10/1) (6/15) Extended Pearson- Tukey Method – Three-point approximation using: • The median value • The 5th percentile (0.05 fractile) value • The 95th percentile (0.95 fractile) value The median gets probability 0.63, and the 5th and 95th percentiles each have 0.185 E (x) = ∑ x * p 5 Decision Tree – Comprehensive tool for modeling all possible decision options – All options, outcomes and consequences, along with the values and probabilities associated with them are shown directly Data – We need to calculate the profit of growing one kind of the crop – Historical prices for each crop – Average costs for each crop (variable costs) • Fertilizer • Labor • Machine π = ∑ price * yield - ∑ cost * yield Preliminary Results Yield Results for Dunmore Soil (no till) Continuous Soybean bu/acre Continuous Corn Grain Stover Continuous Wheat Grain Straw bu/acre tons/acre bu/acre tons/acre Mean 50.41 160.79 5.13 53.98 3.00 Std Dev 3.31 8.86 0.28 8.74 0.53 Min 42.68 134.94 4.33 38.22 2.03 Max 57.10 180.67 5.76 72.42 4.42 6 Fitted Distribution of Soybean yield, Dunmore soil InvGauss(148.57, 302830.83) Shift=-98.161 X <= 45.09 5.0% 0.16 X <= 55.92 95.0% 0.14 0.12 0.1 BestFit Student Version 0.08 For Academic Use Only 0.06 0.04 0.02 0 42 44 46 48 50 52 54 56 58 (Median = 50.407) Yield Results for Dewey Soil (no till) Continuous Soybean Continuous Corn Grain bu/acre bu/acre Stover Continuous Wheat Grain Straw tons/acre bu/acre tons/acre Mean 50.22 160.22 5.11 53.89 2.97 Std Dev 3.60 9.14 0.29 7.81 0.57 Min 37.03 131.91 4.21 37.17 1.98 Max 57.10 180.98 5.78 73.46 4.56 Fitted Distribution of Soybean yield, Dewey soil Logistic(50.2811, 1.9881) X <= 44.43 5.0% 0.16 X <= 56.14 95.0% 0.14 0.12 0.1 BestFit Student Version 0.08 For Academic Use Only 0.06 0.04 0.02 0 35 40 45 50 55 60 (Median = 50.2811) 7 Further Study Find the appropriate prices for the crops and biomass, costs for grow each crop to generate the profits of each crop Develop decision trees to determine which crop is more profitable to grow, and the how much risk it will take to grow the crop Acknowledgement Dr. Burton English Dr. Lixia He Questions? 8

