Phase Diagrams
advertisement
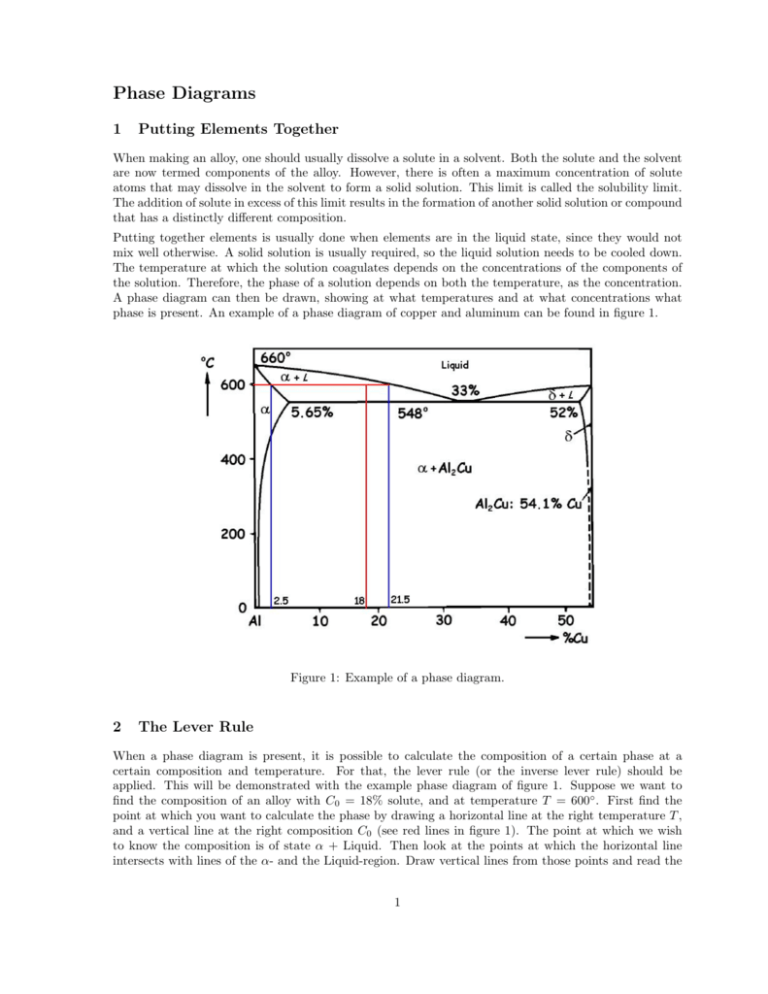
Phase Diagrams 1 Putting Elements Together When making an alloy, one should usually dissolve a solute in a solvent. Both the solute and the solvent are now termed components of the alloy. However, there is often a maximum concentration of solute atoms that may dissolve in the solvent to form a solid solution. This limit is called the solubility limit. The addition of solute in excess of this limit results in the formation of another solid solution or compound that has a distinctly different composition. Putting together elements is usually done when elements are in the liquid state, since they would not mix well otherwise. A solid solution is usually required, so the liquid solution needs to be cooled down. The temperature at which the solution coagulates depends on the concentrations of the components of the solution. Therefore, the phase of a solution depends on both the temperature, as the concentration. A phase diagram can then be drawn, showing at what temperatures and at what concentrations what phase is present. An example of a phase diagram of copper and aluminum can be found in figure 1. Figure 1: Example of a phase diagram. 2 The Lever Rule When a phase diagram is present, it is possible to calculate the composition of a certain phase at a certain composition and temperature. For that, the lever rule (or the inverse lever rule) should be applied. This will be demonstrated with the example phase diagram of figure 1. Suppose we want to find the composition of an alloy with C0 = 18% solute, and at temperature T = 600◦ . First find the point at which you want to calculate the phase by drawing a horizontal line at the right temperature T , and a vertical line at the right composition C0 (see red lines in figure 1). The point at which we wish to know the composition is of state α + Liquid. Then look at the points at which the horizontal line intersects with lines of the α- and the Liquid-region. Draw vertical lines from those points and read the 1 percentages. Call the position of the left vertical line Cα and the right CL . To find Wα , the part of the alloy which has state α, we need to look at the section of the line furthest away from the α-region (this is why they call it the lever rule), and divide it by the total line length. In formula: Wα = CL − C0 21.5 − 18 = = 18.4% CL − Cα 21.5 − 2.5 (1) And to find the part of the alloy which has a liquid state, we need to look at the part of the line furthest away from the liquid region. Naturally, a value of 81.6% will follow. It is also possible to find the composition of the 18.4% α, in terms of copper and aluminum. This is relatively easy to find. Just look at the vertical line closest to the α-region, which has position Cα = 2.5%. The composition of α is therefore 2.5% copper and 97.5% aluminum. In an identical way can be determined that the composition of Liquid is CL = 21.5% copper and 78.5% aluminum. It is always worth checking whether the found percentages add up to the real concentration of copper in the mixture. There is 2.5% copper in 18.4% of the solution, and 21.5% copper in the other 81.6%. Now make the multiplication: 0.025 · 0.184 + 0.215 · 0.816. Note that this is equal to 18%, the concentration of copper in the solution. If it is not, something is wrong with the calculations. Phase diagrams can have multiple types of horizontal axes. Both weight percentage as atom percentage can be the horizontal axis. Therefore you should always take a second look at what kind of concentration you should calculate, to prevent making stupid mistakes. 3 Eutectic Reactions The shape of the phase diagram shown in figure 1 occurs for more alloys than for just copper and aluminum. It is therefore named the binary eutectic phase diagram. Also the lines in the diagram has been named: • Liquidus line - The line between Liquid and α + L, and the line between Liquid and δ + L. • Solidus line - The line between α and α + L, and the line between δ and δ + L. • Solvus line - The line between α and α + δ, and the line between δ and α + δ. Note that the two liquidus lines coincide in a point at 33%. This point is called an invariant point. Upon melting, the two solid α and δ phases transform to a liquid phase. This reaction is called a eutectic reaction (eutectic means easily melted). Often, the horizontal solidus line at T = 548◦ is called the eutectic isotherm. 4 Precipitation Hardening Precipitates are extremely small uniformly dispersed particles of a second phase within the original phase matrix. The strength and hardness of some alloys may be enhanced by the formation of precipitates, accompanied by phase transformations that are induced by appropriate heat treatments. This process is called precipitation hardening. Precipitation hardening, sometimes also called age hardening, is accomplished by two different heat treatments. We once more bring in figure 1 as an example. Suppose we want to use precipitation hardening on a specimen with 2.5% copper. The first heat treatment is a solution heat treatment, in which the material is heated within the α-region, until all the δ-parts disappear. It is then rapidly cooled (called quenching), so the δ-particles will not be able to form. The second heat treatment, called precipitation heat treatment, consists of heating the specimen to a temperature still within the α + δ region, at which temperature diffusion rates become appreciable. Now the δ precipitate phase begins to form as finely dispersed particles. The precipitates often form without 2 this second heat treatment, but this treatment speeds up the process. The forming of precipitates is a time consuming process. Since the material hardens over time, this form of hardening a material is also called age hardening. The strengthening phenomenon is explained in terms of an increased resistance to dislocation motion by lattice strains. These strains are established in the vicinity of the microscopically small precipitate particles. 3
