Ask about EE224
topics and review.
Figure 1.2 (p. 3)
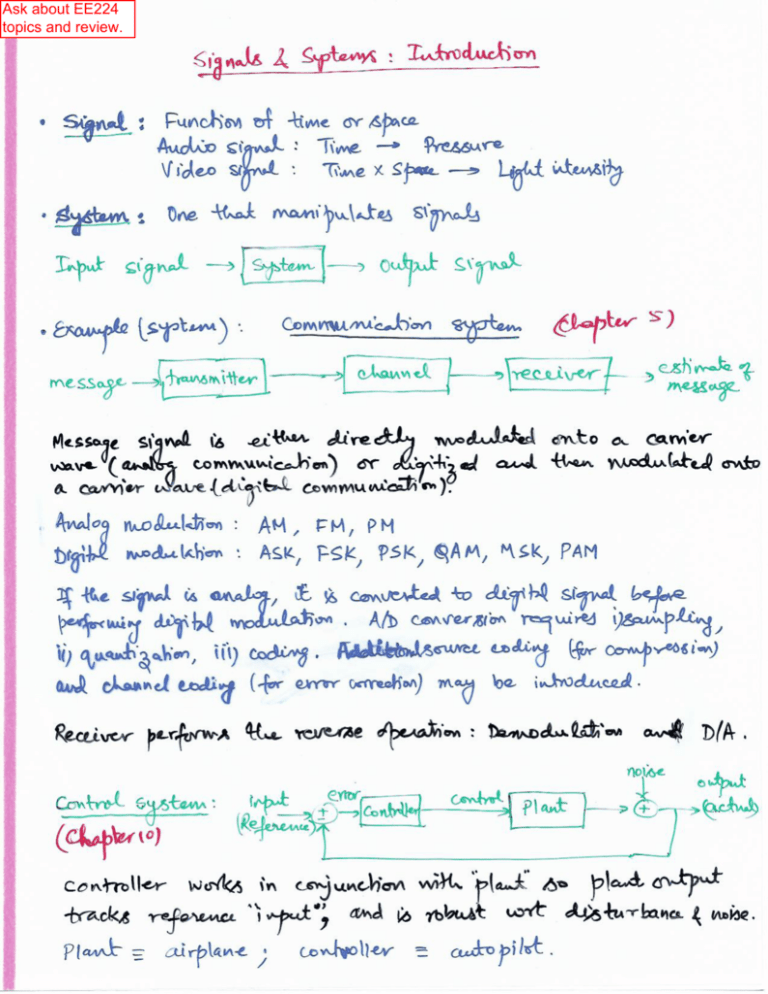
Elements of a communication system. The transmitter changes the
message signal into a form suitable for transmission over the channel.
The receiver processes the channel output (i.e., the received signal) to
produce an estimate of the message signal.
Signals and Systems, 2/E by Simon Haykin and Barry Van Veen
Copyright © 2003 John Wiley & Sons. Inc. All rights reserved.
Figure 1.3 (p. 5)
(a) Snapshot of Pathfinder exploring the
surface of Mars. (b) The 70-meter (230foot) diameter antenna located at
Canberra, Australia. The surface of the
70-meter reflector must remain accurate
within a fraction of the signal’s
wavelength. (Courtesy of Jet Propulsion
Laboratory.)
Signals and Systems, 2/E by Simon Haykin and Barry Van Veen
Copyright © 2003 John Wiley & Sons. Inc. All rights reserved.
Figure 1.4 (p. 7)
Block diagram of a feedback control system. The controller drives the
plant, whose disturbed output drives the sensor(s). The resulting feedback
signal is subtracted from the reference input to produce an error signal e(t),
which, in turn, drives the controller. The feedback loop is thereby closed.
Signals and Systems, 2/E by Simon Haykin and Barry Van Veen
Copyright © 2003 John Wiley & Sons. Inc. All rights reserved.
Figure 1.5 (p. 8)
NASA space shuttle launch.
(Courtesy of NASA.)
Signals and Systems, 2/E by Simon Haykin and Barry Van Veen
Copyright © 2003 John Wiley & Sons. Inc. All rights reserved.
Figure 1.6a (p. 8)
Structure of lateral capacitive
accelerometers.
(Taken from Yazdi et al., Proc. IEEE, 1998)
Signals and Systems, 2/E by Simon Haykin and Barry Van Veen
Copyright © 2003 John Wiley & Sons. Inc. All rights reserved.
Figure 1.6b (p. 9)
SEM view of Analog Device’s ADXLO5 surface-micromachined polysilicon
accelerometer.
(Taken from Yazdi et al., Proc. IEEE, 1998)
Signals and Systems, 2/E by Simon Haykin and Barry Van Veen
Copyright © 2003 John Wiley & Sons. Inc. All rights reserved.
Figure 1.64 (p. 73)
Mechanical lumped model of an accelerometer.
Signals and Systems, 2/E by Simon Haykin and Barry Van Veen
Copyright © 2003 John Wiley & Sons. Inc. All rights reserved.
Figure 1.65 (p. 74)
Periodic frain of rectangular FR pulses used for measuring molar ranges.
Signals and Systems, 2/E by Simon Haykin and Barry Van Veen
Copyright © 2003 John Wiley & Sons. Inc. All rights reserved.
Figure 1.66a (p. 75)
(a) Fluctuations in the closing stock price of Intel over a three-year period.
Signals and Systems, 2/E by Simon Haykin and Barry Van Veen
Copyright © 2003 John Wiley & Sons. Inc. All rights reserved.
Figure 1.66c (p. 76)
(c) Output of an eight-point moving-average system.
Signals and Systems, 2/E by Simon Haykin and Barry Van Veen
Copyright © 2003 John Wiley & Sons. Inc. All rights reserved.
Figure 1.67 (p. 77)
Example of multiple propagation paths in a wireless communication
environment.
Signals and Systems, 2/E by Simon Haykin and Barry Van Veen
Copyright © 2003 John Wiley & Sons. Inc. All rights reserved.
Figure 1.68 (p. 78)
Tapped-delay-line model of a linear communication channel, assumed to
be time-invariant.
Signals and Systems, 2/E by Simon Haykin and Barry Van Veen
Copyright © 2003 John Wiley & Sons. Inc. All rights reserved.
Figure 1.69 (p. 79)
Block diagram of first-order recursive discrete-time filter. The operator S
shifts the output signal y[n] by one sampling interval, producing y[n – 1].
The feedback coefficient p determines the stability of the filter.
Signals and Systems, 2/E by Simon Haykin and Barry Van Veen
Copyright © 2003 John Wiley & Sons. Inc. All rights reserved.


