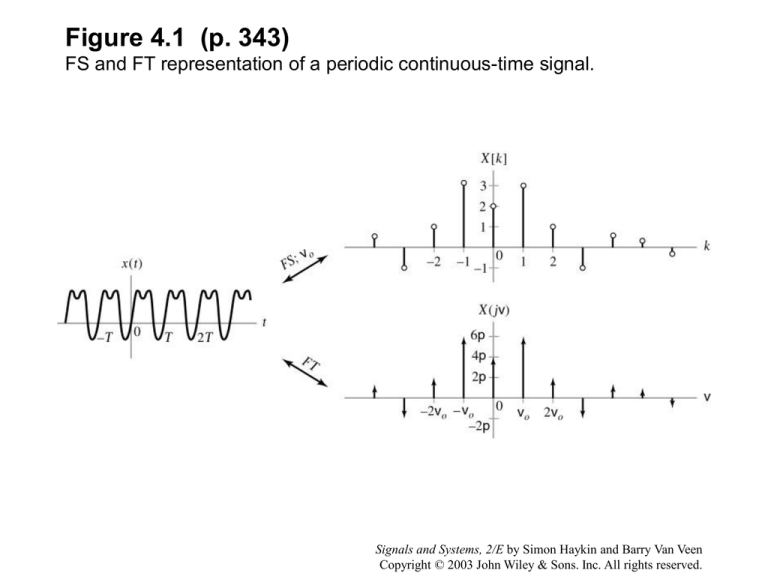
Figure 4.1 (p. 343)
FS and FT representation of a periodic continuous-time signal.
Signals and Systems, 2/E by Simon Haykin and Barry Van Veen
Copyright © 2003 John Wiley & Sons. Inc. All rights reserved.
Figure 4.2 (p. 343)
FT of a cosine.
Signals and Systems, 2/E by Simon Haykin and Barry Van Veen
Copyright © 2003 John Wiley & Sons. Inc. All rights reserved.
Figure 4.3 (p. 344)
An impulse train and its FT.
Signals and Systems, 2/E by Simon Haykin and Barry Van Veen
Copyright © 2003 John Wiley & Sons. Inc. All rights reserved.
Figure 4.4 (p. 345)
Square wave for Problem 4.1.
Signals and Systems, 2/E by Simon Haykin and Barry Van Veen
Copyright © 2003 John Wiley & Sons. Inc. All rights reserved.
Figure 4.5 (p. 346)
Infinite series of frequency-shifted impulses that is 2 periodic in frequency .
Signals and Systems, 2/E by Simon Haykin and Barry Van Veen
Copyright © 2003 John Wiley & Sons. Inc. All rights reserved.
Figure 4.6 (p. 346)
DTFS and DTFT representations of a periodic discrete-time signal.
Signals and Systems, 2/E by Simon Haykin and Barry Van Veen
Copyright © 2003 John Wiley & Sons. Inc. All rights reserved.
Figure 4.7 (p. 347)
DTFT of periodic signal for Example 4.3.
Signals and Systems, 2/E by Simon Haykin and Barry Van Veen
Copyright © 2003 John Wiley & Sons. Inc. All rights reserved.
Figure 4.8 (p. 449)
Convolution property for mixture of periodic and nonperiodic signals.
Signals and Systems, 2/E by Simon Haykin and Barry Van Veen
Copyright © 2003 John Wiley & Sons. Inc. All rights reserved.
Figure 4.9 (p. 350)
Application of convolution property in Example 4.4.
Signals and Systems, 2/E by Simon Haykin and Barry Van Veen
Copyright © 2003 John Wiley & Sons. Inc. All rights reserved.
Figure 4.10 (p. 350)
Signal x(t) for Problem 4.4.
Signals and Systems, 2/E by Simon Haykin and Barry Van Veen
Copyright © 2003 John Wiley & Sons. Inc. All rights reserved.
Figure 4.11 (p. 352)
Multiplication of periodic and
nonperiodic time-domain signals
corresponds to convolution of the
corresponding FT representations.
Signals and Systems, 2/E by Simon Haykin and Barry Van Veen
Copyright © 2003 John Wiley & Sons. Inc. All rights reserved.
Figure 4.12 (p. 353)
Solution for Example 4.5 (b).
Signals and Systems, 2/E by Simon Haykin and Barry Van Veen
Copyright © 2003 John Wiley & Sons. Inc. All rights reserved.
Figure 4.13 (p. 353)
(a) Simplified AM radio transmitter and receiver. (b) Spectrum of message signal.
Signals and Systems, 2/E by Simon Haykin and Barry Van Veen
Copyright © 2003 John Wiley & Sons. Inc. All rights reserved.
Figure 4.14 (p. 354)
Signals in the AM transmitter and
receiver. (a) Transmitted signal r(t)
and spectrum R(j). (b) Spectrum of
q(t) in the receiver. (c) Spectrum of
receiver output y(t).
Signals and Systems, 2/E by Simon Haykin and Barry Van Veen
Copyright © 2003 John Wiley & Sons. Inc. All rights reserved.
Figure 4.15 (p. 357)
Effect of windowing a data record. Y(ej) for different values of M, assuming
that 1 = 7/16 and 2 = 9/16. (a) M = 80, (b) M = 12, (c) M = 8.
Signals and Systems, 2/E by Simon Haykin and Barry Van Veen
Copyright © 2003 John Wiley & Sons. Inc. All rights reserved.
Figure 4.16 (p. 358)
Problem 4.7 (a) System. (b) Input spectrum.
Signals and Systems, 2/E by Simon Haykin and Barry Van Veen
Copyright © 2003 John Wiley & Sons. Inc. All rights reserved.
Figure 4.17 (p. 358)
Solutions to Problem 4.7
Signals and Systems, 2/E by Simon Haykin and Barry Van Veen
Copyright © 2003 John Wiley & Sons. Inc. All rights reserved.
Figure 4.18 (p. 359)
Relationship between FT and DRFT representations of a discrete-time signal.
Signals and Systems, 2/E by Simon Haykin and Barry Van Veen
Copyright © 2003 John Wiley & Sons. Inc. All rights reserved.
Figure 4.19 (p. 361)
Solution to Problem 4.8.
Signals and Systems, 2/E by Simon Haykin and Barry Van Veen
Copyright © 2003 John Wiley & Sons. Inc. All rights reserved.
Figure 4.20 (p. 362)
Relationship between FT and DTFS representations of a discrete-time
periodic signal.
Signals and Systems, 2/E by Simon Haykin and Barry Van Veen
Copyright © 2003 John Wiley & Sons. Inc. All rights reserved.
Figure 4.21 (p. 363)
Mathematical representation of sampling as the product of a given time
signal and an impulse train.
Signals and Systems, 2/E by Simon Haykin and Barry Van Veen
Copyright © 2003 John Wiley & Sons. Inc. All rights reserved.
Figure 4.22 (p. 364)
The FT of a sampled signal for
different sampling frequencies.
(a) Spectrum of continuous-time
signal. (b) Spectrum of sampled
signal when s = 3W.
(c) Spectrum of sampled signal
when s = 2W. (d) Spectrum of
sampled signal when s = 1.5W.
Signals and Systems, 2/E by Simon Haykin and Barry Van Veen
Copyright © 2003 John Wiley & Sons. Inc. All rights reserved.
Figure 4.23 (p. 365)
The DTFTs corresponding to the FTs depicted in Fig. 4-22 (b)-(d). (a) s =
3W. (b) s = 2W. (c) s = 1.5W.
Signals and Systems, 2/E by Simon Haykin and Barry Van Veen
Copyright © 2003 John Wiley & Sons. Inc. All rights reserved.
Figure 4.24 (p.
367)
The effect of sampling a
sinusoid at different rates
(Example 4.9).
(a) Original signal and FT.
(b) Original signal, impulse
sampled representation
and FT for Ts = ¼.
(c) Original signal, impulse
sampled representation
and FT for cT = 1.
(d) Original signal, impulse
sampled representation
and FT for Ts = 3/2. A
cosine of frequency /3 is
shown as the dashed line.
Signals and Systems, 2/E by Simon Haykin and Barry Van Veen
Copyright © 2003 John Wiley & Sons. Inc. All rights reserved.
Figure 4.25 (p.
368)
Aliasing in a movie.
(a) Wheel rotating at
radians per second and
moving from right to left at
meters per second.
b) Sequence of movie
frames, assuming that the
wheel rotates less than
one-half turn between
frames.
(c) Sequences of movie
frames, assuming that the
wheel rotates between
one-half and one turn
between frames.
(d) Sequence of movie
frames, assuming that the
wheel rotates one turn
between frames.
Signals and Systems, 2/E by Simon Haykin and Barry Van Veen
Copyright © 2003 John Wiley & Sons. Inc. All rights reserved.
Figure 4.26 (p. 368)
Spectrum of original signal for Problem 4.10.
Signals and Systems, 2/E by Simon Haykin and Barry Van Veen
Copyright © 2003 John Wiley & Sons. Inc. All rights reserved.
Figure 4.27 (p. 369)
Solution to Problem 4.10.
Signals and Systems, 2/E by Simon Haykin and Barry Van Veen
Copyright © 2003 John Wiley & Sons. Inc. All rights reserved.
Figure 4.28 (p. 370)
Factor determining the quality of the discrete-time model for the two-path
communication channel.
Signals and Systems, 2/E by Simon Haykin and Barry Van Veen
Copyright © 2003 John Wiley & Sons. Inc. All rights reserved.
Figure 4.29 (p. 372)
Effect of subsampling on the DTFT.
(a) Original signal spectrum.
(b) m = 0 term, Xq(ej), in Eq. (4.27)
(c) m = 1 term in Eq. (4.27).
(d m = q – 1 term in Eq. (4.27).
(e) Y(ej), assuming that W < /q.
(f) Y(ej), assuming that W > /q.
Signals and Systems, 2/E by Simon Haykin and Barry Van Veen
Copyright © 2003 John Wiley & Sons. Inc. All rights reserved.
Figure 4.30 (p. 373)
Solution to Problem 4.11.
Signals and Systems, 2/E by Simon Haykin and Barry Van Veen
Copyright © 2003 John Wiley & Sons. Inc. All rights reserved.
Figure 4.31 (p. 373)
Block diagram illustrating conversion of a discrete-time signal to a
continuous-time signal.
Signals and Systems, 2/E by Simon Haykin and Barry Van Veen
Copyright © 2003 John Wiley & Sons. Inc. All rights reserved.
Figure 4.32 (p. 373)
Two continuous-time signals x1(t) (dashed line) and x2(t) (solid line) that
have the same set of samples.
Signals and Systems, 2/E by Simon Haykin and Barry Van Veen
Copyright © 2003 John Wiley & Sons. Inc. All rights reserved.
Figure 4.33 (p. 374)
FT of continuous-time signal for Example 4.12.
Signals and Systems, 2/E by Simon Haykin and Barry Van Veen
Copyright © 2003 John Wiley & Sons. Inc. All rights reserved.
Figure 4.34 (p. 375)
FT of x(t) for Problem 4.12(c).
Signals and Systems, 2/E by Simon Haykin and Barry Van Veen
Copyright © 2003 John Wiley & Sons. Inc. All rights reserved.
Figure 4.35 (p. 376)
Ideal reconstruction. (a) Spectrum of original signal. (b) Spectrum of
sampled signal. (c) Frequency response of reconstruction filter.
Signals and Systems, 2/E by Simon Haykin and Barry Van Veen
Copyright © 2003 John Wiley & Sons. Inc. All rights reserved.
Figure 4.36 (p. 377)
Ideal reconstruction in the time
domain.
Signals and Systems, 2/E by Simon Haykin and Barry Van Veen
Copyright © 2003 John Wiley & Sons. Inc. All rights reserved.
Figure 4.37 (p. 377)
Reconstruction via a zero-order hold.
Signals and Systems, 2/E by Simon Haykin and Barry Van Veen
Copyright © 2003 John Wiley & Sons. Inc. All rights reserved.
Figure 4.38 (p. 378)
Rectangular pulse used to analyze zero-order hold reconstruction.
Signals and Systems, 2/E by Simon Haykin and Barry Van Veen
Copyright © 2003 John Wiley & Sons. Inc. All rights reserved.
Figure 4.39 (p. 379)
Effect of the zero-order hold in the
frequency domain. (a) Spectrum of
original continuous-time signal. (b)
FT of sampled signal. (c) Magnitude
and phase of Ho(j). (d) Magnitude
spectrum of signal reconstructed
using zero-order hold.
Signals and Systems, 2/E by Simon Haykin and Barry Van Veen
Copyright © 2003 John Wiley & Sons. Inc. All rights reserved.
Figure 4.40 (p. 380)
Frequency response of a compensation filter used to eliminate some of the
distortion introduced by the zero-order hold.
Signals and Systems, 2/E by Simon Haykin and Barry Van Veen
Copyright © 2003 John Wiley & Sons. Inc. All rights reserved.
Figure 4.41 (p. 380)
Block diagram of a practical reconstruction system.
Signals and Systems, 2/E by Simon Haykin and Barry Van Veen
Copyright © 2003 John Wiley & Sons. Inc. All rights reserved.
Figure 4.42 (p. 382)
Anti-imaging filter design
with and without
oversampling. (a) Magnitude
of Ho(jf) for 44.1-kHz
sampling rate. Dashed lines
denote signal passband and
images. (b) Magnitude of
Ho(jf) for eight-times
oversampling (352.8-kHz
sampling rate. Dashed lines
denote signal passband and
images. (c) Normalized
constraints on passband
response of anti-imaging
filter. Solid lines assume a
44.1-kHz sampling rate;
dashed lines assume eighttimes oversampling. The
normalized filter response
must lie between each pair
of lines.
Signals and Systems, 2/E by Simon Haykin and Barry Van Veen
Copyright © 2003 John Wiley & Sons. Inc. All rights reserved.
Figure 4.43 (p.383)
Block diagram for discrete-time processing of continuous-time signals.
(a) A basic system. (b) Equivalent continuous-time system.
Signals and Systems, 2/E by Simon Haykin and Barry Van Veen
Copyright © 2003 John Wiley & Sons. Inc. All rights reserved.
Figure 4.44 (p. 385)
Effect of oversampling on anti-aliasing filter specifications. (a) Spectrum of original
signal. (b) Anti-aliasing filter frequency response magnitude. (c) Spectrum of signal
at the anti-aliasing filter output. (d) Spectrum of the anti-aliasing filter output after
sampling. The graph depicts the case of s > 2Ws.
Signals and Systems, 2/E by Simon Haykin and Barry Van Veen
Copyright © 2003 John Wiley & Sons. Inc. All rights reserved.
Figure 4.45 (p. 387)
Effect of changing the sampling rate. (a) Underlying continuous-time signal FT. (b)
DTFT of sampled data at sampling interval Ts1. (c) DTFT of sampled data at
sampling interval Ts2.
Signals and Systems, 2/E by Simon Haykin and Barry Van Veen
Copyright © 2003 John Wiley & Sons. Inc. All rights reserved.
Figure 4.46 (p. 387)
The spectrum that results from subsampling the DTFT X2(ej) depicted in
Fig. 4.45 by a factor of q.
Signals and Systems, 2/E by Simon Haykin and Barry Van Veen
Copyright © 2003 John Wiley & Sons. Inc. All rights reserved.
Figure 4.47 (p. 388)
Frequency-domain
interpretation of decimation.
(a) Block diagram of decimation
system. (b) Spectrum of
oversampled input signal. Noise
is depicted as the shaded
portions of the spectrum.
(c) Filter frequency response.
(d) Spectrum of filter output.
(e) Spectrum after
subsampling.
Signals and Systems, 2/E by Simon Haykin and Barry Van Veen
Copyright © 2003 John Wiley & Sons. Inc. All rights reserved.
Figure 4.48 (p. 389)
Symbol for decimation by a factor of q.
Signals and Systems, 2/E by Simon Haykin and Barry Van Veen
Copyright © 2003 John Wiley & Sons. Inc. All rights reserved.
Figure 4.49 (p. 390)
Frequency-domain
interpretation of
interpolation. (a) Spectrum
of original sequence.
(b) Spectrum after inserting
q – 1 zeros in between every
value of the original
sequence. (c) Frequency
response of a filter for
removing undesired
replicates located at 2/q,
4/q, …, (q – 1)2/q.
(d) Spectrum of interpolated
sequence.
Signals and Systems, 2/E by Simon Haykin and Barry Van Veen
Copyright © 2003 John Wiley & Sons. Inc. All rights reserved.
Figure 4.50 (p. 390)
(a) Block diagram of an interpolation system. (b) Symbol denoting
interpolation by a factor of q.
Signals and Systems, 2/E by Simon Haykin and Barry Van Veen
Copyright © 2003 John Wiley & Sons. Inc. All rights reserved.
Figure 4.51 (p. 391)
Block diagram of a system for discrete-time processing of continuous-time
signals including decimation and interpolation.
Signals and Systems, 2/E by Simon Haykin and Barry Van Veen
Copyright © 2003 John Wiley & Sons. Inc. All rights reserved.
Figure 4.52 (p. 392)
The DTFS of a finite-duration nonperiodic signal.
Signals and Systems, 2/E by Simon Haykin and Barry Van Veen
Copyright © 2003 John Wiley & Sons. Inc. All rights reserved.
Figure 4.53 (p. 394)
The DTFT and length-N DTFS of a
32-point cosine. The dashed line
denotes |X(ej)|, while the stems
represent N|X[k]|. (a) N = 32, (b) N =
60, (c) N = 120.
Signals and Systems, 2/E by Simon Haykin and Barry Van Veen
Copyright © 2003 John Wiley & Sons. Inc. All rights reserved.
Figure 4.54 (p. 396)
Block diagram depicting the sequence of operations involved in
approximating the FT with the DTFS.
Signals and Systems, 2/E by Simon Haykin and Barry Van Veen
Copyright © 2003 John Wiley & Sons. Inc. All rights reserved.
Figure 4.55 (p. 397)
Effect of aliasing.
Signals and Systems, 2/E by Simon Haykin and Barry Van Veen
Copyright © 2003 John Wiley & Sons. Inc. All rights reserved.
Figure 4.56 (p. 398)
Magnitude response of M-point window.
Signals and Systems, 2/E by Simon Haykin and Barry Van Veen
Copyright © 2003 John Wiley & Sons. Inc. All rights reserved.
Figure 4.57 (p. 400)
The DTFS approximation to the FT of x(t) = e-1/10 u(t)(cos(10t) + cos(12t). The solid line is the
FT |X(j)|, and the stems denote the DTFS approximation NTs|Y[k]|. Both |X(j) and NTs|Y[k]|
have even symmetry, so only 0 < < 20 is displayed. (a) M = 100, N = 4000. (b) M = 500, N =
4000. (c) M = 2500, N = 4000. (d) M = 2500, N = 16,0000 for 9 < < 13.
Signals and Systems, 2/E by Simon Haykin and Barry Van Veen
Copyright © 2003 John Wiley & Sons. Inc. All rights reserved.
Figure 4.58 (p. 404)
The DTFS approximation to the FT of x(t) = cos(2(0.4)t) + cos(2(0.45)t). The stems denote |Y[k]|, while the
solid lines denote (1/M|Y (j)|. The frequency axis is displayed in units of Hz for convenience, and only
positive frequencies are illustrated. (a) M = 40. (b) M = 2000. Only the stems with nonzero amplitude are
depicted. (c) Behavior in the vicinity of the sinusoidal frequencies for M = 2000. (d) Behavior in the vicinity of
the sinusoidal frequencies for M = 2010.
Signals and Systems, 2/E by Simon Haykin and Barry Van Veen
Copyright © 2003 John Wiley & Sons. Inc. All rights reserved.
Figure 4.59 (p. 406)
Block diagrams depicting the
decomposition of an inverse DTFS
as a combination of lower order
inverse DTFS’s. (a) Eight-point
inverse DTFS represented in terms
of two four-point inverse DTFS’s. (b)
four-point inverse DTFS
represented in terms of two-point
inverse DTFS’s. (c) Two-point
inverse DTFS.
Signals and Systems, 2/E by Simon Haykin and Barry Van Veen
Copyright © 2003 John Wiley & Sons. Inc. All rights reserved.
Figure 4.60 (p. 407)
Diagram of the FFT algorithm for computing x[n] from X[k] for N = 8.
Signals and Systems, 2/E by Simon Haykin and Barry Van Veen
Copyright © 2003 John Wiley & Sons. Inc. All rights reserved.
Figure 4.61 (p. 409)
Original and resampled signals obtained using MATLAB.
Signals and Systems, 2/E by Simon Haykin and Barry Van Veen
Copyright © 2003 John Wiley & Sons. Inc. All rights reserved.
Figure 4.62 (p. 411)
The use of the MATLAB command p l o t for displaying the DTFS
coefficients in case (b) of Example 4.16.
Signals and Systems, 2/E by Simon Haykin and Barry Van Veen
Copyright © 2003 John Wiley & Sons. Inc. All rights reserved.
Figure P4.16 (p. 413)
Signals and Systems, 2/E by Simon Haykin and Barry Van Veen
Copyright © 2003 John Wiley & Sons. Inc. All rights reserved.
Figure P4.17 (p. 413)
Signals and Systems, 2/E by Simon Haykin and Barry Van Veen
Copyright © 2003 John Wiley & Sons. Inc. All rights reserved.
Figure P4.18 (p. 414)
Signals and Systems, 2/E by Simon Haykin and Barry Van Veen
Copyright © 2003 John Wiley & Sons. Inc. All rights reserved.
Figure P4.19 (p. 414)
Signals and Systems, 2/E by Simon Haykin and Barry Van Veen
Copyright © 2003 John Wiley & Sons. Inc. All rights reserved.
Figure P4.20 (p. 414)
Signals and Systems, 2/E by Simon Haykin and Barry Van Veen
Copyright © 2003 John Wiley & Sons. Inc. All rights reserved.
Figure P4.21 (p. 414)
Signals and Systems, 2/E by Simon Haykin and Barry Van Veen
Copyright © 2003 John Wiley & Sons. Inc. All rights reserved.
Figure P4.23 (p. 415)
Signals and Systems, 2/E by Simon Haykin and Barry Van Veen
Copyright © 2003 John Wiley & Sons. Inc. All rights reserved.
Figure P4.26 (p. 415)
Signals and Systems, 2/E by Simon Haykin and Barry Van Veen
Copyright © 2003 John Wiley & Sons. Inc. All rights reserved.
Figure P4.28 (p. 416)
Signals and Systems, 2/E by Simon Haykin and Barry Van Veen
Copyright © 2003 John Wiley & Sons. Inc. All rights reserved.
Figure P4.29 (p. 416)
Signals and Systems, 2/E by Simon Haykin and Barry Van Veen
Copyright © 2003 John Wiley & Sons. Inc. All rights reserved.
Figure P4.30 (p. 416)
Signals and Systems, 2/E by Simon Haykin and Barry Van Veen
Copyright © 2003 John Wiley & Sons. Inc. All rights reserved.
Figure P4.33 (p. 416)
Signals and Systems, 2/E by Simon Haykin and Barry Van Veen
Copyright © 2003 John Wiley & Sons. Inc. All rights reserved.
Figure P4.34 (p. 417)
Signals and Systems, 2/E by Simon Haykin and Barry Van Veen
Copyright © 2003 John Wiley & Sons. Inc. All rights reserved.
Figure P4.35 (p. 417)
Signals and Systems, 2/E by Simon Haykin and Barry Van Veen
Copyright © 2003 John Wiley & Sons. Inc. All rights reserved.
Figure P4.41 (p. 418)
Signals and Systems, 2/E by Simon Haykin and Barry Van Veen
Copyright © 2003 John Wiley & Sons. Inc. All rights reserved.
Figure P4.45 (p. 419)
Signals and Systems, 2/E by Simon Haykin and Barry Van Veen
Copyright © 2003 John Wiley & Sons. Inc. All rights reserved.
Figure P4.47 (p. 419)
Signals and Systems, 2/E by Simon Haykin and Barry Van Veen
Copyright © 2003 John Wiley & Sons. Inc. All rights reserved.
Figure P4.48 (p. 420)
Signals and Systems, 2/E by Simon Haykin and Barry Van Veen
Copyright © 2003 John Wiley & Sons. Inc. All rights reserved.
Figure P4.49 (p. 420)
Signals and Systems, 2/E by Simon Haykin and Barry Van Veen
Copyright © 2003 John Wiley & Sons. Inc. All rights reserved.
Figure P4.50 (p. 420)
Signals and Systems, 2/E by Simon Haykin and Barry Van Veen
Copyright © 2003 John Wiley & Sons. Inc. All rights reserved.
Figure P4.51 (p. 421)
Signals and Systems, 2/E by Simon Haykin and Barry Van Veen
Copyright © 2003 John Wiley & Sons. Inc. All rights reserved.

