Hi to all
advertisement
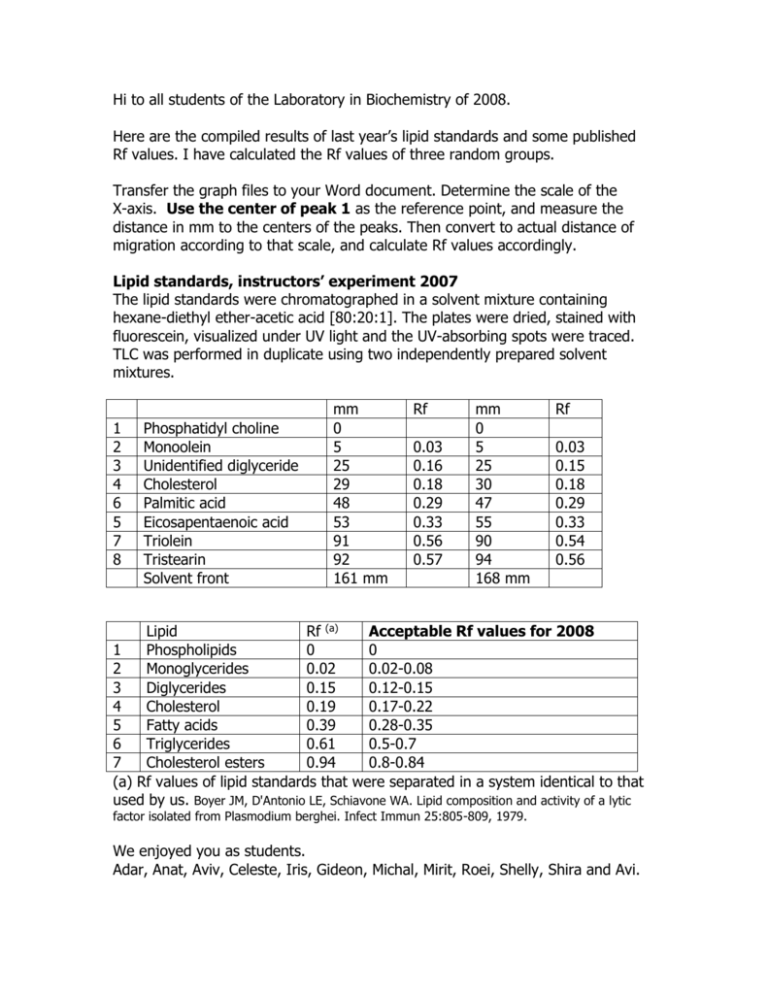
Hi to all students of the Laboratory in Biochemistry of 2008. Here are the compiled results of last year’s lipid standards and some published Rf values. I have calculated the Rf values of three random groups. Transfer the graph files to your Word document. Determine the scale of the X-axis. Use the center of peak 1 as the reference point, and measure the distance in mm to the centers of the peaks. Then convert to actual distance of migration according to that scale, and calculate Rf values accordingly. Lipid standards, instructors’ experiment 2007 The lipid standards were chromatographed in a solvent mixture containing hexane-diethyl ether-acetic acid [80:20:1]. The plates were dried, stained with fluorescein, visualized under UV light and the UV-absorbing spots were traced. TLC was performed in duplicate using two independently prepared solvent mixtures. 1 2 3 4 6 5 7 8 Phosphatidyl choline Monoolein Unidentified diglyceride Cholesterol Palmitic acid Eicosapentaenoic acid Triolein Tristearin Solvent front mm 0 5 25 29 48 53 91 92 161 mm Rf 0.03 0.16 0.18 0.29 0.33 0.56 0.57 mm 0 5 25 30 47 55 90 94 168 mm Rf 0.03 0.15 0.18 0.29 0.33 0.54 0.56 Lipid Rf (a) Acceptable Rf values for 2008 1 Phospholipids 0 0 2 Monoglycerides 0.02 0.02-0.08 3 Diglycerides 0.15 0.12-0.15 4 Cholesterol 0.19 0.17-0.22 5 Fatty acids 0.39 0.28-0.35 6 Triglycerides 0.61 0.5-0.7 7 Cholesterol esters 0.94 0.8-0.84 (a) Rf values of lipid standards that were separated in a system identical to that used by us. Boyer JM, D'Antonio LE, Schiavone WA. Lipid composition and activity of a lytic factor isolated from Plasmodium berghei. Infect Immun 25:805-809, 1979. We enjoyed you as students. Adar, Anat, Aviv, Celeste, Iris, Gideon, Michal, Mirit, Roei, Shelly, Shira and Avi.
