Statistics Formulas - howardmulvihillsclassroom
advertisement
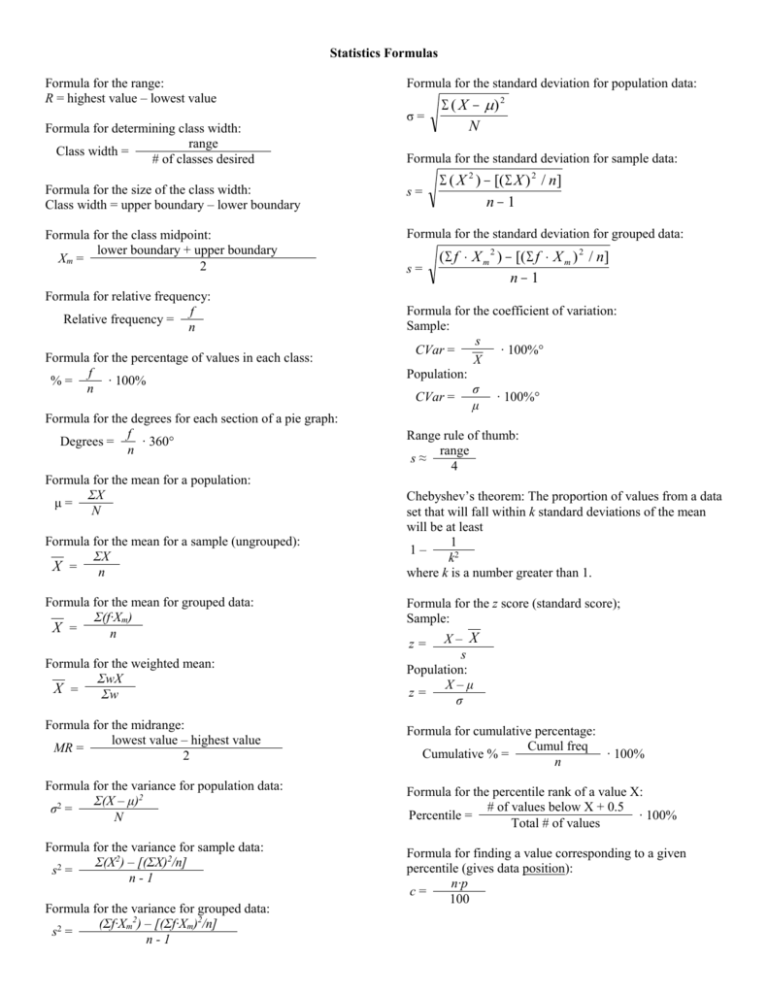
Statistics Formulas Formula for the range: R = highest value – lowest value Formula for the standard deviation for population data: σ= Formula for determining class width: range Class width = # of classes desired ( X ) 2 N Formula for the standard deviation for sample data: ( X 2 ) [( X ) 2 / n] n 1 Formula for the size of the class width: Class width = upper boundary – lower boundary s= Formula for the class midpoint: lower boundary + upper boundary Xm = 2 Formula for the standard deviation for grouped data: Formula for relative frequency: f Relative frequency = n Formula for the percentage of values in each class: f %= ∙ 100% n Formula for the degrees for each section of a pie graph: f Degrees = ∙ 360° n Formula for the mean for a population: ΣX μ= N Formula for the mean for a sample (ungrouped): ΣX X = n Formula for the mean for grouped data: Σ(f∙Xm) X = n s= ( f X m 2 ) [( f X m ) 2 / n] n1 Formula for the coefficient of variation: Sample: s CVar = ∙ 100%° X Population: σ CVar = ∙ 100%° μ Range rule of thumb: range s≈ 4 Chebyshev’s theorem: The proportion of values from a data set that will fall within k standard deviations of the mean will be at least 1 1– k2 where k is a number greater than 1. Formula for the z score (standard score); Sample: Formula for the weighted mean: ΣwX X = Σw X– X s Population: X–μ z= σ Formula for the midrange: lowest value – highest value MR = 2 Formula for cumulative percentage: Cumul freq Cumulative % = ∙ 100% n Formula for the variance for population data: Σ(X – μ)2 σ2 = N Formula for the percentile rank of a value X: # of values below X + 0.5 Percentile = ∙ 100% Total # of values Formula for the variance for sample data: Σ(X2) – [(ΣX)2/n] s2 = n-1 Formula for finding a value corresponding to a given percentile (gives data position): n∙p c= 100 Formula for the variance for grouped data: (Σf∙Xm2) – [(Σf∙Xm)2/n] s2 = n-1 z= Formula for interquartile range: IQR = Q3 – Q1 Formulas for range to exclude outliers: Q1 – IQR(1.5) and Q3 + IQR(1.5) Permutations: (order is important) “How many different ways…” The arrangement of n objects in a specific order using r objects at a time. n Probability Formulas P( X ) 1 and 0 P( X ) 1 Classical Probability: Number of outcomes in E Total number of outcomes in sample space or P(E) = n(E) n(S) Complementary Events: Pr n! (n r )! n = total # in population; r = # selected Combinations: (order is not important) The number of combinations of r objects selected from n objects. n Cr n! (n r )! r ! Mean of a Probability Distribution: X = ∑[X ∙ P(X)] P( E ) = 1 – P(E) or P(E) = 1 – P( E ) or Variance for a Population Distribution: P(E) + P( E ) = 1 2 [( X 2 P( X )] 2 Empirical Probability: Round to 2 or 3 decimal places or fully reduce fraction. frequency for the class f P(E) = = total frequency in the distribution n Standard Distribution for a Probability Distribution: Addition Rules (Or events): When two events are mutually exclusive, the probability that A or B will occur is: P(A or B) = P(A) + P(B) If A and B are not mutually exclusive, then: P(A or B) = P(A) + P(B) – P(A and B) Multiplication Rules (And events): When two events are independent, the probability of both occurring is: P(A and B) = P(A) ∙ P(B) When two events are dependent, the probability of both occurring is: P(A and B) = P(A) ∙ P(B|A) Conditional Probability—The probability that the second event B occurs given that the first event A has occurred can be found by dividing the probability that both events occurred by the probability that the first event has occurred. The formula is: P(A and B) P(B|A) = P(A) Fundamental Counting Rule: k1 ∙ k2 ∙ k3 ∙ ∙ ∙ kn Factorial Notation: 5! = 5 ∙ 4 ∙ 3 ∙ 2 ∙ 1 4! = 4 ∙ 3 ∙ 2 ∙ 1 Note that 0! = 1 [ X 2 P( X )] 2 or 2 Expected Value: E(X) = ∑[X ∙ P(X)] or E(X) = X ∙ P(X) of gain + X ∙ P(X) of loss Binomial probability formula: (round to 3 decimal places) P( X ) n! p x q n X (n X )! X ! P(S) = probability of success P(S) = p; P(F) = probability of failure P(F) = 1-p = q; p = numerical probability of success; q = numerical probability of failure; n = number of trials; X = number of successes in n trials. Mean of a binomial distribution: μ=n∙p Variance of a binomial distribution: 2 n p q Standard deviation of a binomial distribution: n p q or 2 Formula for the z value (or standard score): X z or value - mean z= standard deviation Formula for finding a specific data value: X z Formula for the mean of the sample means: X Formula for the standard error of the mean: X n Formula for the z value for the central limit theorem (for a sample mean when the variable is normally distributed or when the sample size is 30 or more): X z / n Formula for the z value for the central limit theorem (for individual data when the variable is normally distributed): X z Finite population correction factor when large samples are taken from small population: N n N is the population size and n is the sample size. N 1 Standard area of the mean using correction factor: N n X N 1 n Formula for z value using correction factor: X z N n N 1 n s s X t / 2 X t / 2 STAT; TESTS; 8 n n t /2 found in Table F; use C.I. in top row and degree of freedom (n – 1) in left column. Proportion Notation: p = population proportion; p = sample proportion X p and q 1 p where X = number of sample units n that possess the characteristics of interest and n = sample size. Formula for a specific C.I. for a proportion: pq pq when np and nq are ≥ 5. p z / 2 p p z / 2 n n STAT; TESTS; A Formula for minimum sample size needed for interval estimate of a population proportion: 2 z / 2 ; round up to obtain whole number. n pq E If sample proportion unavailable, use 0.5 for p and q . Formula for the C.I. for a variance: n 1s 2 2 n 1s 2 ; d.f. = n – 1 2 2 X right X left s2 = variance; s = standard deviation; square number in formula only when appropriate. Formula for the C.I. for a standard deviation: Formulas for the mean and standard deviation for the binomial distribution: n p and n p q ; n p 5 , n q 5 Formula for a Specific Confidence Interval for the Mean when σ (pop. S.D.) is known or n ≥ 30) and Sample Size: X z / 2 X z / 2 STAT; TESTS; 7 n n z /2 for 90% C.I. 1.65, for 95% 1.96, for 98% 2.33, for 99% 2.58 To find other z /2 : C.I./2, find answer in body of Table E (closest or higher if halfway), use corresponding z score. Formula for minimum sample size needed for an interval estimate of the population mean: z n /2 ; E = maximum error of estimate; always E round to next whole number 2 Formula for a Specific Confidence Interval for the Mean when σ is unknown and n < 30: n 1s 2 2 X right n 1s 2 2 X left ; d.f. = n – 1 2 To find: X right : Calculate (1 – C.I.)/2. Go to Table G—use 2 with d.f. to find X right . 2 X left : 1 – [(1 – C.I.)/2]. Look up in Table G. (1 – C.I. is α) Chapter 8—Hypothesis Testing z Test for a Mean (n ≥ 30 or σ is known): (observed value) – (expected value) Test value = standard error z X STAT; TESTS; 1 / n X = sample mean, μ = hypothesized population mean, σ = population standard deviation, n = sample size Critical Value for Specific α Values (Table E): One-tailed: 0.5 –α Two-tailed: 0.5 –α/2 Find value obtained in Table E; use closest value. Find z-value corresponding to area. P-value (≤ α = reject Ho): One-tailed: Find area corresponding to z score. 0.5 – area Two-tailed: Find area corresponding to z score. (0.5 – area)2 t Test for a Mean (σ unknown and n < 30): t X s/ n P-value Interval (≤ α = reject Ho): Right-tailed: Look across row with d.f. needed and find two values that X2 falls between. Look to top and find corresponding α values. Left-tailed: Above then subtract both from 1. :Look to top and find corresponding α values. Two-tailed: Above for right- or left-tailed then double. Chapter 9—Difference Between Two Means, Variances, and Proportions z Test for Comparing Two Means from Independent Populations: Large Samples z ( X1 X 2 ) ( 1 2 ) 12 n1 Critical Value (Table F): One-tailed: Where α for one-tailed and d.f. meet (use appro.– or + #). Two-tailed: Where α for two-tailed and d.f. meet (both signs). P-value (if α not in interval, reject Ho or P-value < α): Find the two values that the t score in row with appropriate d.f. fall between; look up corresponding α’s at top (one- or two-tailed); put into inequality format (smallest # first). STAT; TESTS; 3 n2 Confidence Interval for Difference Between Means: Large Samples (if C.I. does not contain zero, reject Ho). ( X1 X 2 ) z / 2 12 n1 22 1 2 STAT; TESTS; 9 n2 12 ( X1 X 2 ) z / 2 STAT; TESTS; 2 s = sample standard deviation 22 n1 When n1 ≥ 30 and n2 ≥ 30, s12 22 n2 and s22 can be used in place of 12 and 22 . F Test for the Difference Between Two Variances F s12 s22 STAT; TESTS; E Larger variance always in the numerator. Hypothesis: 12 22 , etc. Two-tailed test: α/2; C.V. on right side Square standard deviations if used. Table H—If d.f. not found, use closest smaller value. z Test for a Proportion: p p z p pq / n STAT; TESTS; 5 X (sample proportion), p = population proportion, n n = sample size, q = 1 – p Critical Values and P-value: As in z test for mean. 2 X Test for a Variance or Standard Deviation: X2 (n 1) s2 2 n = sample size, s2 = sample variance, σ2 = population variance; d.f. = n – 1. Critical Value (Table G): Right-tailed: Find where d.f. and α meet. Left-tailed: Find where d.f. and 1 – α meet. Two-tailed: Find where d.f. meets α/2 and 1 – α/2. t Test for Difference Between Two Means—Small Independent Samples Variances assumed to be unequal: t ( X1 X 2 ) ( 1 2 ) s12 s22 n1 n2 STAT; TESTS; 4; Pool No d.f. = small of n1 – 1 or n2 – 1. Variances assumed to be equal: t ( X1 X 2 ) ( 1 2 ) (n1 1) s12 (n2 1) s22 n1 n2 2 d.f. = n1 n2 2 1 1 n1 n2 Pool Yes Confidence Intervals for the Difference of Two Means: Small Independent Samples Variances unequal: ( X1 X 2 ) t / 2 s12 s22 1 2 STAT; TESTS; 0; Pool No n1 n2 s12 s22 n1 n2 ( X1 X 2 ) t / 2 ( X1 X 2 ) t / 2 (n2 1) s22 n1 n2 2 1 1 n1 n2 d.f. = n1 + n2 -2 Pool Yes t Test for Difference Between Two Means: Small Dependent Samples t D D STAT; TESTS; 2 (L3 = L1 – L2) sD / n ( D)2 n ; D X1 X2 ; and n1 D2 D ; sD D 0 ; D n D2 ( X1 X2 )2 Confidence Interval for the Mean Difference sD n D D t / 2 sD n STAT; TESTS; 8 (L3 above) d.f. = n – 1 z Test for Comparing Two Proportions z ( p1 p2 ) ( p1 p2 ) 1 1 pq ( n1 n2 STAT; TESTS; 6 where X1 X 2 ; q 1 p ; n1 n2 X X p1 1 ; p2 2 n1 n2 p Confidence Interval for Difference Between Two Proportions ( p1 p2 ) z / 2 p1q1 p2q2 n1 n2 STAT; TESTS; B p1 p2 ( p1 p2 ) z / 2 p1q1 p 2q2 n1 n2 Chapter 10—Correlation and Regression Correlation Coefficient r r Regression Line y’ = a + bx ( y)( x 2 ) ( x )( xy ) n( x 2 ) ( x ) 2 n( xy ) ( x )( y ) n( x 2 ) ( x ) 2 a is the y1 intercept and b is the slope of the line. Standard Error of the Estimate sest ( y y )2 or n 2 y 2 a y b xy n 2 Prediction Interval about a Value y’ y t / 2 sest 1 1 n( x X ) 2 n n x 2 ( x )2 y y t / 2 sest 1 d.f. = n – 1 D t / 2 n 2 1 r2 d.f. = n – 2 b (n1 1) s12 (n2 1) s22 1 1 n1 n2 2 n1 n2 1 2 ( X1 X 2 ) t / 2 tr a d.f. = smaller of n1 – 1 or n2 – 1. Variances equal: (n1 1) s12 t Test for Correlation Coefficient n( xy ) ( x )( y ) [n( x ) ( x ) 2 ][n( y 2 ) ( y ) 2 ] 2 n is number of data pairs STAT; CALC; 8 d.f. = n – 2 1 n( x X ) 2 n n x 2 ( x )2


