comparative study of sub-maximal exercise test in a group of
advertisement
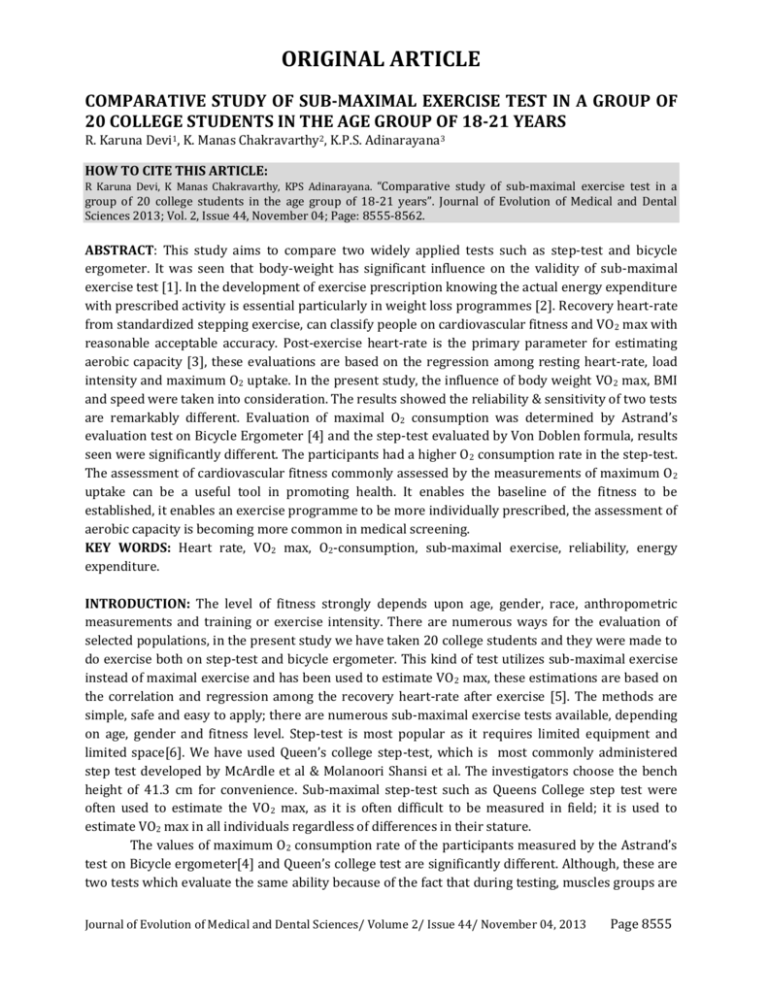
ORIGINAL ARTICLE COMPARATIVE STUDY OF SUB-MAXIMAL EXERCISE TEST IN A GROUP OF 20 COLLEGE STUDENTS IN THE AGE GROUP OF 18-21 YEARS R. Karuna Devi1, K. Manas Chakravarthy2, K.P.S. Adinarayana3 HOW TO CITE THIS ARTICLE: R Karuna Devi, K Manas Chakravarthy, KPS Adinarayana. “Comparative study of sub-maximal exercise test in a group of 20 college students in the age group of 18-21 years”. Journal of Evolution of Medical and Dental Sciences 2013; Vol. 2, Issue 44, November 04; Page: 8555-8562. ABSTRACT: This study aims to compare two widely applied tests such as step-test and bicycle ergometer. It was seen that body-weight has significant influence on the validity of sub-maximal exercise test [1]. In the development of exercise prescription knowing the actual energy expenditure with prescribed activity is essential particularly in weight loss programmes [2]. Recovery heart-rate from standardized stepping exercise, can classify people on cardiovascular fitness and VO2 max with reasonable acceptable accuracy. Post-exercise heart-rate is the primary parameter for estimating aerobic capacity [3], these evaluations are based on the regression among resting heart-rate, load intensity and maximum O2 uptake. In the present study, the influence of body weight VO2 max, BMI and speed were taken into consideration. The results showed the reliability & sensitivity of two tests are remarkably different. Evaluation of maximal O2 consumption was determined by Astrand’s evaluation test on Bicycle Ergometer [4] and the step-test evaluated by Von Doblen formula, results seen were significantly different. The participants had a higher O2 consumption rate in the step-test. The assessment of cardiovascular fitness commonly assessed by the measurements of maximum O 2 uptake can be a useful tool in promoting health. It enables the baseline of the fitness to be established, it enables an exercise programme to be more individually prescribed, the assessment of aerobic capacity is becoming more common in medical screening. KEY WORDS: Heart rate, VO2 max, O2-consumption, sub-maximal exercise, reliability, energy expenditure. INTRODUCTION: The level of fitness strongly depends upon age, gender, race, anthropometric measurements and training or exercise intensity. There are numerous ways for the evaluation of selected populations, in the present study we have taken 20 college students and they were made to do exercise both on step-test and bicycle ergometer. This kind of test utilizes sub-maximal exercise instead of maximal exercise and has been used to estimate VO2 max, these estimations are based on the correlation and regression among the recovery heart-rate after exercise [5]. The methods are simple, safe and easy to apply; there are numerous sub-maximal exercise tests available, depending on age, gender and fitness level. Step-test is most popular as it requires limited equipment and limited space[6]. We have used Queen’s college step-test, which is most commonly administered step test developed by McArdle et al & Molanoori Shansi et al. The investigators choose the bench height of 41.3 cm for convenience. Sub-maximal step-test such as Queens College step test were often used to estimate the VO2 max, as it is often difficult to be measured in field; it is used to estimate VO2 max in all individuals regardless of differences in their stature. The values of maximum O2 consumption rate of the participants measured by the Astrand’s test on Bicycle ergometer[4] and Queen’s college test are significantly different. Although, these are two tests which evaluate the same ability because of the fact that during testing, muscles groups are Journal of Evolution of Medical and Dental Sciences/ Volume 2/ Issue 44/ November 04, 2013 Page 8555 ORIGINAL ARTICLE not loaded in the same way, this can influence different cardio-respiratory and metabolic reactions[7]. Many of the available sub-maximal test are developed to estimate the fitness necessary for physically demanding occupations, but they are no longer used now for occupational screening, because participants sometimes used drugs[8]. The tests remains useful however especially for groups of individuals participating in an exercise programme. VO2 max is the maximum volume of O2 that body can consume during intense whole body exercise; this volume is expressed as ml/Kg/Min. Because O2 consumption is linearly related to energy expenditure, when we measure O2 consumption [9], we are indirectly measuring an individual’s maximal capacity to work aerobically. Improving your VO2 max without changing any other performance factors can improve one’s performance. Sedentary VO2 max values are genetically determined; all individuals can make drastic improvement in VO2 max with right training stimulus. This genetic variation helps explain why everyone cannot train themselves to be elite. METHODS AND MATERIALS: 20 male college students of 1st year M.B.B.S. of NRI institute of medical sciences, Vishakapatnam in the age group of 18-22 years participated in the study, they were randomly selected from the department of Physiology based on the student availability during the period of data collection. All the subjects were average college students without active sports training. All the subjects in the study were informed of the testing procedures, approved consent was taken. Participants were screened for cardiovascular, pulmonary and orthopedic problems, pharmacological treatment, lower extremities disease and anomalies were excluded. Heights, Weight, BMI were measured. All the subjects were thoroughly informed about the purpose, risk and benefits of the study. Every subject performed one test on alternate days. Step Test: QCT was performed on a bench height of 41.3 cm for a total duration of 3 minutes. The participant avoids strenuous exercise in the 48 hours preceding exercise. The bench height was chosen for convenience [10]. 5 min of quiet rest was required before the step-test; resting HR was noted for 15 sec. After rest, the subject was asked to do step up & down movement on a bench for 3 minutes in total. If a subject felt fatigue, he could stop the test. Subject should stand quietly upon the completion of test. Palpate radial pulse and count for 15 sec starting the count at 3.05 min and stopping at 3.20 mins. Have the subject cool down by walking and stretching the gastrocnemius & quadriceps for the next 5 mins. Journal of Evolution of Medical and Dental Sciences/ Volume 2/ Issue 44/ November 04, 2013 Page 8556 ORIGINAL ARTICLE Bicycle Ergometer: The evaluation of VO2 max was determined by Astrand’s evaluation test on bicycle ergometer [4] in the Dept. of Physiology, NRIIMS, Vishakapatnam on the same 20 medical students 48 hours after the step-test. Informed consent was taken. Explained purpose & procedure of the test to the subject. Measure resting HR, Blood Pressure, height & weight. Calculated age predicted max HR for test termination if required by the test protocol. 6 min single stage Astrand’s rhyming protocol was used. Equipment needed is stationary cycle ergometer, B.P apparatus, stethoscope, water & towels, timer Adjust the seat height of the cycle, so that the knees are almost completely extended, as your foot goes through the bottom of the pedaling cycle. If the heart rate goes beyond 170beats/min, or if you experiences any unusual symptoms stop pedaling and rest for 15-20 mins and repeat the test at a lower work load. Ride the cycle for 6 minutes. During the last 10 sec of the 6th min of the ride 10 sec pulse count was taken. Cool down after the test. RESULT: The results clearly showed more energy expenditure per unit time in case of step test, when compared to cycle ergometer. As weight increases energy expenditure per unit time increases remarkably in the case of step-test, but in cycle ergometer there was very slight increase. An inverse relation was seen between VO2 max & heart-rate both in step-test and cycle ergometer. As BMI increases, energy expenditure per unit time also increases in step-test and this is not seen in cycle ergometer. A good correlation between speed of exercise and energy expenditure per unit time was seen in both. S.No 1 2 3 4 5 6 7 8 9 10 11 12 13 14 15 16 WEIGHT (kg) 45 52 55 55 55 56 57 59 61 62 62 65 65 68 68 70 POWER (kg.m/min) BMI STEP TEST CYCLE ERGOMETER 20.4 20.8 18.3 18.3 23.9 22.4 18.3 19.6 21 22.9 21 21.6 22.8 21.9 24.2 24.3 315.9 315.9 522.4 454.3 590.6 670.7 447.3 644.3 730.6 563.3 454.3 644.3 590.6 645.9 702.1 664.9 250.4 208.05 463.98 385.89 353.4 485.64 572.28 682.29 594.51 526.11 442.32 648.09 463.41 447.45 417.24 453.72 RECOVERY HR (beats/min) CYCLE STEP TEST ERGOMETER 140 140 176 120 140 160 132 148 164 148 120 148 128 148 128 160 160 144 184 160 180 164 168 168 192 172 172 164 172 168 160 176 SPEED (m/min) VO2 Max (ml/kg/min) STEP TEST CYCLE ERGOMETER STEP TEST CYCLE ERGOMETER 7.02 7.02 9.49 8.26 10.73 11.97 7.84 9.91 11.97 9.08 8.26 9.91 9.08 9.49 10.32 9.49 125.4 104 232 192.9 176.7 242.8 286.1 341.1 297.3 263.1 221.2 324 231.7 231.7 208.6 226.9 39.9 39.9 37.4 60.9 39.9 44.1 55.9 49.1 42.4 49.1 60.9 49.1 57.6 49.1 42.1 44.1 32.66 36.35 22.9 26.72 22.9 33.75 33.15 35.59 20.65 27.09 20.32 33.92 24.23 21.6 27.8 18 Journal of Evolution of Medical and Dental Sciences/ Volume 2/ Issue 44/ November 04, 2013 Page 8557 ORIGINAL ARTICLE 17 18 19 70 74 75 23.12 23.1 22.5 590.6 703 712.4 277.59 416.67 410.97 128 140 156 160 168 168 9.08 9.49 9.49 138.8 208.3 205.5 57.6 52.4 45.8 22.5 19.86 19.6 20 76 25.3 847.5 565.44 176 196 11.15 282.7 37.3 13.81 21.79 2 0.4 590.5 134.2 30 453.27 121.4 27.1 145 16 3.6 169.8 11.5 2.5 9.453 1.3 0.3 227 60.7 13.5 47.73 7.5 1.6 25.67 6.4 1.4 MEAN SD SE HISTOGRAM 1: COMPARISON OF ENERGY EXPENDITURE PER UNIT TIME BETWEEN STEP TEST AND CYCLE ERGOMETER HISTOGRAM 2: COMPARISON OF Vo2 max BETWEEN STEP TEST AND CYCLE ERGOMETER Journal of Evolution of Medical and Dental Sciences/ Volume 2/ Issue 44/ November 04, 2013 Page 8558 ORIGINAL ARTICLE GRAPH-1 GRAPH-3 GRAPH-5 GRAPH-2 GRAPH-4 GRAPH-6 Journal of Evolution of Medical and Dental Sciences/ Volume 2/ Issue 44/ November 04, 2013 Page 8559 ORIGINAL ARTICLE GRAPH-7 GRAPH-9 GRAPH-8 GRAPH-10 DISCUSSION: The work on a gym bench in relation to a bicycle ergometer is different based on the engaged muscles and their mass and because of that the load on cardiovascular System is different. It means that the person does not have the same physiological reaction to different types of load, even when it is the same in terms of amount of work. n the exercising human, maximal O2 uptake is limited by the ability of cardio-respiratory system to deliver oxygen to the exercising muscles[11]. Increase in VO2 max with training results primarily from an increase in maximum cardiac output. VO2 max is an important variable which sets the upper limit for endurance performance. Body weight and body height are significantly influential factors as they are closely related to load intensity of a test. It was seen that the body weight has a significant influence on the test reliability, while the influence of body height was at a minimal level [12]. The participants had a higher O2 consumption rate on the step-test, when compared to cycle ergometer. The energy expenditure per unit time was also more in step test when compared to cycle ergometer. This is clearly depicted in Histograms I & II and table-I. The difference can be explained by the fact that the physiological reaction of the body in step test is different in comparison to work on a bicycle ergometer. Step-test is considered to be a practical field test for assessing individual aerobic fitness. Post exercise heart-rate is the primary parameter for estimating aerobic capacity[13]. It was seen that individuals with more body weight spend more energy both in step-test and cycle ergometer. This clearly shows that the body weight has a significant influence on the test reliability. The reliability in the step-test was more when compared to the cycle ergometer this is seen in graph I & II. External work output is determined routinely during cycle ergometry or other exercises such as stair climbing or bench stepping. Heavier individuals expend more energy in most physical activities than their lighter counter parts simply because of the cost of moving the added body weight [14]. Total daily energy expenditure depends largely on the type, intensity and duration of physical activity; these activities play an important role in weight, physical conditioning and cardiac rehabilitation [15]. Force acting through a vertical distance (F x D) usually recorded as Kg-m – yields external work output. External work output is determined routinely during cycle ergometry, stair climbing or bench stepping. In horizontal running or walking work output cannot be computed because Journal of Evolution of Medical and Dental Sciences/ Volume 2/ Issue 44/ November 04, 2013 Page 8560 ORIGINAL ARTICLE technically external work does not occur, reciprocal leg and arm movements negate each other and body achieves no net gain in vertical distance [16]. Factors effecting exercise are environmental temperature, emotional state, previous food intake, body position, muscle groups exercised, continuous or discontinuous nature of the exercise and whether the muscles act structurally or more dynamically. Since the accuracy of the test relays on heart rate response, try to eliminate the factors that might alter the heart rate. It was observed that heart rate is inversely propositional to VO 2 max both in step-test & bicycle ergometer, the correlation was good in both the cases and it is clearly depicted in graphs III & IV. A slight correlation was seen between energy expenditure per unit time and VO2 max. It was also observed that as energy expenditure per unit time increases, VO2 decreases. In the step test the ‘R’ value was only 0.19 this is shown in Graph-V. Graph-VI shows, no correlation between VO2 max & energy expenditure in cycle ergometer. There was high correlation between energy expenditure per unit time & speed in both step test & cycle ergometer. As the speed increases, energy expenditure per unit time also increases [17]. This is seen in Graph VII & VIII. When BMI & energy expenditure per unit time were compared, there was increased energy expenditure per unit time when BMI increased in the case of step-test, this is clearly seen in GraphII. Whereas, no correlation was observed between BMI & energy expenditure per unit time in cycle ergometer, this is seen in Graph-X. CONCLUSION: Significant differences in physiological responses between the two tests were seen. The present study clearly demonstrates that aerobic stepping on 41.3 cm bench height is more suitable to improve cardio-respiratory fitness and in prescribing weight loss exercises. Step aerobics is practiced in health centers, fitness training gyms and academic institutions all over the world because of its simplicity. ACKNOWLEDGMENT: We extend our thanks to Ms V.B.S. Kumar Setty, B.Sc (Chemistry), Clerk in Department of Biochemistry, NRI Medical Collage, Sanghivalasa, Visakhapatnam, Andhra Pradesh, India. BIBILOGRAPHY: 1. Coyle, E.F & J.O. Hollozy. Integration of the physiological factors determining endurance performance ability -Exercise and sports sciences review-1995 pg 25 to 63. 2. American college of sports medicine. ACSM's guidelines for exercise testing and prescription. Williams & Wilkins, 1995. 3. McArdle's text book of exercise physiology section 3 energy transfer page 224-predicting vo2 max using step test recovery heart rate. 4. Astrand PO and I Ryhming. A nomogram for calculation of aerobic capacity (physical fitness) from pulse rate during submaximal exercise. J.Appl.physiol, 7:218 to 221,1954. 5. International Quartely of sports science 2009/2-A study on estimating vo2 max from different techniques in field situation-J.P. Vema et all. Journal of Evolution of Medical and Dental Sciences/ Volume 2/ Issue 44/ November 04, 2013 Page 8561 ORIGINAL ARTICLE 6. Scharff. olson M, Williford HN, Blessing DL and Brown JA. The physiological effects of bench/step exercise sports Med, 1996:21(3):164 to 175. 7. Cavanagh P and R. Kram-mechanical and muscular factors affecting the efficiency of human movement. Med.sci.sports exerc.17:326-331,1985. 8. Tesch, P.A. Exerise performance and beta-blockade. Sports Med.2:389-412,1985. 9. McArdle WD-Katch F.I Pechar G.S-Reliability and inter-relationship between maximal oxygen intake, physical work capacity and step test scores in college women, Med sci.sport 4:182. 10. WD McArdle, F.I. Katch G.S. Pechar, L. Jacobson S Ruck. Med sci sports exerc.1972. 11. American college of sports medicine. Med Sci Sports Exerc.1998;22:265-274. 12. Jaswant Singh Thakur et all-USRD-TNTT,Vol-1(2),2010,72-77. 13. Chin-Mou Liu, Kuei-Fu-Lin-J.Exerc.Sci.Fit.vol.5.no.2-2007 14. WD McArdle; Katch I.F, Katch L.V,1991. Exerc physiology 3rd edition Lea and Febiger, philadelphia/London pg-219. 15. Buch Fuhrer M.J; J. E Hansen et all-J. Appl. physiol 1983;55:1558-1564. 16. McArdle’s Essentials of Exercise Physiology; energy expenditure during rest and physical activity chap. 8, Pg 247. 17. Waters RL, Lunsford BR, Perry J et all-standard tables J. Orthopaed Res,1988,6:215-222. AUTHORS: 1. R. Karuna Devi 2. K. Manas Chakravarthy 3. K.P.S. Adinarayana PARTICULARS OF CONTRIBUTORS: 1. Associate Professor, Department of Physiology, NRI Institute of Medical Sciences, Visakhapatnam, Andhra Pradesh. 2. Tutor, Department of Physiology, NRI Institute of Medical Sciences, Visakhapatnam, Andhra Pradesh. 3. Associate Professor, Department of Anatomy, Andhra Medical College, Visakhapatnam, Andhra Pradesh. NAME ADDRESS EMAIL ID OF THE CORRESPONDING AUTHOR: Dr. R. Karuna Devi, D.No. 49-9-33, Lalitha Nagar, Visakhapatnam – 530016, Andhrapradesh. Email – karunarednam@yahoo.com Date of Submission: 11/10/2013. Date of Peer Review: 12/10/2013. Date of Acceptance: 23/10/2013. Date of Publishing: 29/10/2013 Journal of Evolution of Medical and Dental Sciences/ Volume 2/ Issue 44/ November 04, 2013 Page 8562
