Bubbling Cabomba
advertisement
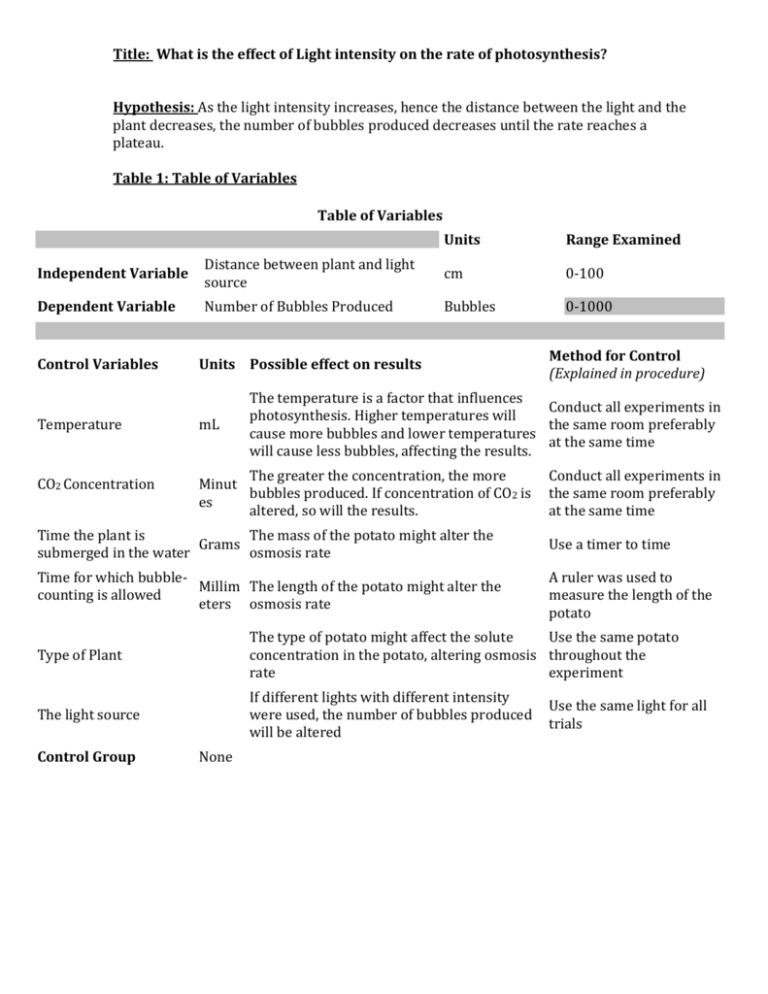
Title: What is the effect of Light intensity on the rate of photosynthesis? Hypothesis: As the light intensity increases, hence the distance between the light and the plant decreases, the number of bubbles produced decreases until the rate reaches a plateau. Table 1: Table of Variables Table of Variables Units Range Examined Independent Variable Distance between plant and light source cm 0-100 Dependent Variable Number of Bubbles Produced Bubbles 0-1000 Control Variables Temperature CO2 Concentration Units Possible effect on results mL Method for Control (Explained in procedure) The temperature is a factor that influences Conduct all experiments in photosynthesis. Higher temperatures will the same room preferably cause more bubbles and lower temperatures at the same time will cause less bubbles, affecting the results. The greater the concentration, the more Minut bubbles produced. If concentration of CO2 is es altered, so will the results. Conduct all experiments in the same room preferably at the same time Time the plant is The mass of the potato might alter the Grams submerged in the water osmosis rate Use a timer to time Time for which bubbleMillim The length of the potato might alter the counting is allowed eters osmosis rate A ruler was used to measure the length of the potato Type of Plant The type of potato might affect the solute Use the same potato concentration in the potato, altering osmosis throughout the rate experiment The light source If different lights with different intensity were used, the number of bubbles produced will be altered Control Group None Use the same light for all trials Table 2: Effects of Light Intensity on the Number of Bubbles Produced Data Collection Table Bubbles Produced Per Minute (Bubbles/min) Distance from Light Source (cm) 0 15 25 50 75 100 Uncertainty of Ruler +/- 0.5 (mm) Uncertainty of Bubbles +/- 10.0 (Bubbles) Trials 1 29.0 62.0 0.0 0.0 0.0 0.0 2 17.0 0.0 0.0 0.0 0.0 0.0 3 300.0 143.0 120.0 1.0 0.0 0.0 4 135.0 93.0 30.0 0.0 0.0 0.0 5 116.0 134.0 15.0 0.0 0.0 0.0 6 130.0 64.0 37.0 0.0 0.0 0.0 7 195.0 129.0 78.0 0.0 0.0 0.0 8 574.0 330.0 62.0 0.0 0.0 0.0 Observations: Since there is no technical way to count the amount of bubbles produced by the plants other than counting through the human eye, the uncertainty of the calculation will be relatively large. The experimenters set the uncertainty for the bubbles to be +/-10 bubbles because when the bubbles are being produced rapidly, a stream of bubbles arises in the blink of an eye. As the experimenters replayed the video in slow motion, the experimenters estimated that approximately 10 bubbles go pass with one blink of an eye. However, the uncertainty of the ruler is +/-0.5mm. There are two outliers presented in the data above, which are highlighted in yellow. The 0cm trial for the 8th trial is an outlier because 574 does not fall within two standard deviations of the mean (574>547.524). The 15cm trial for the 8th trial is also an outlier because 330 does not fall within two standard deviations of the mean (330>314.357). Therefore, these two points are considered outliers and will be omitted from the data processing. For the 7th and 8th trial for distances 0cm and 15 cm, the experimenters noticed that the bubbles were appearing rapidly and rose to the top in streams. Thus it made it really hard to count the exact amount of bubbles produced since the bubbles were really small and produced in large quantities. Also, the temperature for the 7th and 8th trail for distances 0cm and 15cm increased after the trial was conducted. Process Data: Processed Data (DCP Aspect 2) Table 3: Effects of Light Intensity on Number of Bubbles Produced Processed Data Table Distance from Light Source (cm) 0 15 25 50 75 100 Average Number of Bubbles Produced Per Minute (Bubbles/min) 131.7 89.3 42.8 0.1 0.0 0.0 STDEV 96.9 51.4 41.8 0.4 0.0 0.0 -0.7 Correlation In this table, the average is calculated after the two outliers were removed from the data. The corresponding standard deviation and correlation were adjusted to values after the outliers were removed as well. After conducting a t-test on the oxygen production for the 0cm to 100cm trial, the experimenters suggest that there is a significant statistical difference between the data, since the two-tailed P value was 0.0171. Sample Calculations for Processed Data. Average (Bubbles) (Calculated by Excel): (All the data for 0cm trial were calculated and presented below) Standard Deviation (Bubbles) (Calculated by Excel): (all data for 0cm trial were calculated and presented below: T-test (Calculated by GraphPad): (all data for 0cm-100cm trial were calculated and presented below) Slope (Bubbles/min) (Calculated by Excel): (all values for the 0cm-15cm trial were calculated and presented below) R-value (Calculated by Excel): (all values for the 0cm-15cm trial were calculated and presented below) Presenting Processed Data (DCP Aspect 3) Graph 1: The graph above illustrates the relationship between bubbles produced per minute and the distance of the plant from the light source with the outliers removed. There is an indirect relationship between the amount of bubbles produced per minute and the distance of plant from light source- as the distance increases between the plant and the light source, the amount of bubbles produced decrease. After conduction the correlation test, the researchers found that the correlation is -0.7, indicating a moderate, negative correlation between the two variables. Graph: 2 The values for error bars are +/-96.9, +/-51.4, +/-41.8, +/-0.4, 0, and 0 for trials 0cm, 15cm, 25cm, 50cm, 75cm, and 100cm, respectively. The error bars for distances of 0cm, 15cm, and 25cm have a slightly overlap with each other. This suggests that there is not a really big variation between the data within those parts. However, the error bars for the 0cm, 15cm, and 25cm trial do not overlap with the errors bars for the 50cm, 75cm, and 100cm trial at all. This suggests that there is a big variation between the data, and that the variation most likely is not due to chance. Thus the difference is significant. However, the error bar for the 0cm trial is really big, meaning that there is a big variation in the data. The overall trend is as distance from the light source increases, average bubbles produced per minute increases. DISCUSSION, EVALUATION & CONCLUSION (Criteria DEC) Discussing and Reviewing (DCE Aspect 1) Light intensity affects the rate of photosynthesis. As the distance between the light source and the plant, which indirectly measures light intensity, increases, the amount of bubbles produced by the plant, which indirectly measures photosynthetic rate, decreases. There is an indirect relationship between light intensity and photosynthetic rate. The amount of bubbles produced measures the photosynthetic rate. The average amount of bubbles produced per minute was 131.714 when the distance between the light source and plant was 0cm, while during the 100cm trial the average amount of bubbles produced per minute was 0. There is a big difference between the amounts of bubbles produced. Also, the Rvalue of -0.7 supports the moderate, negative relationship between the two variables. Thus, the hypothesis is supported by the data collected in the investigation. Photosynthetic rate is affected by light intensity, temperature, and carbon dioxide concentration. Light intensity affects photosynthetic rate because as there is more light available for the plant, there are more photons as reactants available for the chlorophyll to react with. As the number of collisions increase, the photosynthetic rate increases (Benckiser). The experimenters cannot find accepted values for all distances in the experiment. The experimenters compared the experimental values with those of another study conducted by another experimenter as a reference (Light). The number of bubbles differed by a lot, which a percentage discrepancy of 99% for the 50cm trial. However, the overall trend exhibited in both experiments ware similar. The big percentage of discrepancy can be attributed to the imprecise counting method, and the different light bulbs used in the two experiments. The general trend shows the relationship between the independent and dependent variable: as the distance between the plant and the light source increases, the number of bubbles produced decreases; therefore assuring the accuracy. Evaluating Procedures and Suggesting Improvements: (DCE Aspect 2) A) ACCURACY, PRECISION and RELIABILITY Since the experimenters could not find any accepted values of the experiment, it is hard to determine the exact extent of accuracy of this experiment. However, the experiment should be considered relatively accurate since it exhibits a similar trend to all the other studies the experimenters found that were conducted on the same matter. The data is relatively low in precision. The error bars for the 0cm, 15cm, and 25cm have error bars that overlap, yet the error bars are really big. This shows there is a big variation in the data, as all data points are quite spread out. Also, the standard deviation for trials 0cm, 15cm, and 25cm of data are really big. For example, the standard deviation for the 0cm trial goes up to 96.9, which is a huge variation in data. There is a big standard deviation in our data due to the imprecise measuring method. Also, the experimenters calculated the % discrepancy between the experimenter’s trial and the class average for the 25cm trial. The results were a % discrepancy of 30.9%, indicating a relatively large discrepancy. All experimenters did a different trial, and each experimenter had a different counting method for the bubbles. Thus, the data collected were not similar, indicating low precision. The data is relatively reliable due to the trend found in the graph without outliers. As graph 2 indicates, there is an obvious observable trend showing that as the distance between the light source and plant increases, the number of bubbles decreased. However, though the over all trend is obvious, the R-value is -0.7, which is only a moderate value. There are no known systematic errors presented in the data, since all data follow an observable trend and all equipment were used correctly, assuring no systematic errors. Some random errors have caused impacts on the data, which will be discussed in the experimental weakness and limitations section below. In conclusion, the overall accuracy of the data is adequate due to the observable trend in the data. However, the precision is relatively low due to the big standard deviations in the data. The reliability of the data is adequate due to the moderate R-value. B) EXPERIMENTAL WEAKNESSES AND LIMITATIONS The procedure was easy to follow and there were no major difficulties in keeping the control variables constant, and all the independent variables were manipulated accordingly to produce the most accurate and precise results possible. The control variables were mostly kept constant throughout the experiment. The type of plant used was ensured to be Cabomba, which ensures the relative amount of chlorophylls involved in the reaction. The temperature of all trials would be the same since all trials were conducted at the same time in the same room. The CO2 concentration was also held constant throughout the experiment as all trials were conducted in the same room. The time the plant was submerged in the water was a total of 3 minutes, which consists of 2 minutes of observing and a minute of counting for all trials. The experimenters only started counting the number of bubbles the Cobomba plants produced in each trial 2 minutes after the plant was submerged. The counting continued for one minute for every trial. Lastly, the light used to shine on the plants was consistent, as it was from the same light throughout all the trials. These procedures ensure that the changes measured in the dependent variable were a true reflection of manipulating the independent variable. This assures the fairness and validity of the data. Also, the range of the independent variable was not appropriate because starting from the 50cm trial, the data collected were almost all 0. This means that the distance between the light source and the plant was already too big at 50cm, which means that any distance greater than that would not have an impact on the data. Therefore, the range of the independent variable was inappropriate. Another weakness was the large spread of data in almost all trials. This spread is due to the imprecise measuring method of measuring the bubbles. All experimenters used their human eyes to physically count the amount of bubbles produced, which is really inaccurate, especially for the trials of closer distance since the rate of bubbles being produced is so fast that it is really hard to count every single bubble. This resulted in the large spread of data, especially the first few trials with distances of 0cm, 15cm, and 25cm. The equipment used was mostly accurate and precise. All the rulers used to measure the length of the Cobomba plants were standardized, and all timers were standardized as well. Some random errors were made throughout the experiment. For the first trial, the experimenter cut the plant with a straight cut, while for all the other trials, the experimenter cut the plant diagonally. Since the surface area might have an impact on the results produced, this error might have altered the results for the 0cm trial from Group 8. However, the impact can be ignored since Group 8’s 0cm trial data was already an outlier and omitted from the analysis of data. Also, the number of leafs on each plant was really hard to be kept consistent. Even though it is easy to measure out the length of the plant and cut it accordingly, the number of leafs on each of the sections of plants will still vary. Therefore, the amount of chlorophyll present to allow photosynthesis varies amongst each plant. This is a considerable impact on the data because the more leafs a plant has, the higher the photosynthetic rate and vice versa. Thus, this limitation should be valued greatly. Lastly, the rise in temperature should be considered, especially for the 0cm trial. Since the higher the temperature, the greater the photosynthetic rate, and since the light was right next to the plant for the 0cm trial, the temperature rose from 22 to 24, which most certainly had an impact on the data. Thus, for at least the 0cm trial, both the light intensity and the temperature altered the photosynthetic rate, which explains why there were so many bubbles produced during the 0cm trial for all groups. Overall, random errors can be ranked in the following order based on their impact on data from smallest to greatest: the cutting method of the plant, the number of leafs on the plant, and the rise in temperature for the trials. The impacts of how each individual factor affected the data were discussed above. The lack in trials is also a weakness of the experiment. 8 Trials might be enough to determine the general trend of the data, but it is not enough to establish an experiment with high precision. The weaknesses of the experiment can be ranked in the following order based on their impact on the data from smallest to greatest: inappropriate range of independent variable, cutting method of the plant, the number of leafs on the plant, the rise in temperature for the trials, the lack in trials and the imprecise counting method of bubbles which caused a large spread in data. Lastly, this experiment is not reproducible based on several reasons. First, the difficulty of counting the air bubbles. As mentioned before, experimenters have different ways of counting air bubbles, and as the experimenter changes, the results will change as well. Second, the wide range of the individual data shows that the data is really wide spread, meaning that other scientists have a smaller probability of getting the same results when they repeat the experiment. Lastly, since there are too many variables that might change the data that would be hard for experimenters to control, like the number of leafs on each plant, it is really hard to produce the same results as those of this lab. However, the overall reliability of the trend is high. The general trend shows an apparent decrease in photosynthetic rate after an increase in distance between the light source and the plant, which is supported by scientific evidence. C) EXPERIMENTAL IMPROVEMENTS In order to ensure the accuracy of the experiment and minimize the effects of random errors, there are a few things that can be improved upon. First of all, the experimenters should always keep in mind to keep a consistent cut while cutting the plant, preferably a diagonal cut across the plant. If one of the plants were cut inconsistently, the experimenters should cut another plant that has a diagonal cut. This will help minimize the random errors made during the experiment. Secondly, the appropriate data range should be set around a range from 0cm to 50cm, as the experiment showed that any value above 50cm seemed to have no impact on the photosynthetic rate. Therefore, appropriate trial distances should consist of trials with distances such as 0cm, 5cm, 10cm, 15cm, 20cm, 30cm, 40cm, and 50cm. This way, the experimenters can take a closer examination to see exactly how much each distance impacts the data and photosynthetic rate. Also, there should be a better way to measure the number of bubbles produced. A way to improve this significant limitation is to use a camera device with the function of recording in slow motion to record every trial, and the experimenters can play the video in slow motion and count all the bubbles produced. This will significantly reduce the imprecision in data, since most of it is caused by the poor bubble-counting method. A better improvement to this limitation would be to use a Photosynthesis Measurement System called LCpro+ (ADC) that allows experimenters to control the concentrations of CO2 and H20, therefore ensuring a more precise experiment. Moreover, the experimenters not only should keep the length of the plant consistent, they should also keep the number of leafs on each plant relatively consistent as well. While they cut the plants out, they should make sure the leafs on each plant are roughly the same, and pull out the extra leafs on each plant. This will also reduce the imprecision in data because the number of chlorophyll present in each leaf directly determines the rate of photosynthesis. By controlling the number of leafs, which in turn affects the number of chlorophylls, the experiment would improve in terms of precision. In addition, the experimenters should pay attention to the change in temperature in the trials. Since there is not a better way to keep the temperature constant, the experimenters should just always consider the rise in temperature while evaluating the experiment. Lastly, more trials should be conducted to ensure the reliability of the experiment. Eight trials do not provide a strong scientific evidence for the investigated question. Therefore, by increasing the number of trials conduced to at least 50 trials, it increases the chances of having more precise, accurate, and reliable data. Concluding: (DCE Aspect 3) In conclusion, the distance between the light source and plant affects the production of bubbles; hence the light intensity affects the rate of photosynthesis. The greater the light intensity, the greater the amount of bubbles produced, hence the greater the photosynthetic rate. For example, the 0cm trial had an average of 131.7 bubbles, while the 100cm trial had an average of 0 bubbles, showing a clear decrease in the oxygen production. Therefore, the relationship between light intensity and photosynthetic rate is established. Reference Cited: "ADC BioScientific Ltd." ADC Bioscientific. N.p., n.d. Web. 02 Mar. 2013. Benckiser, Reckitt. "Rate of Photosynthesis: Limiting Factors." Rate of Photosynthesis: Limiting Factors (n.d.): n. pag. Advancing the Chemical Sciences. RSC. Web. 31 Oct. 2014. "Light Intensity and Rate of Photosynthesis (Carol Cao) - Sed695b3." Light Intensity and Rate of Photosynthesis (Carol Cao) - Sed695b3. N.p., n.d. Web. 31 Oct. 2014. Experiment Title: Photosynthesis rate and light intensity Student name: SL Submitted to Turn it In for plagiarism check: Y N Teacher: Ms. Tyler Date: HL Total DATA COLLECTION & PROCESSING ASPECT 1. Recording raw data Records appropriate quantitative & associated qualitative raw data, including units & uncertainties where relevant. Stu Partial Incompl Teac den (1 ete (0 her t mark) marks) Complete (2 marks) eval che uati ckli on st a. Includes descriptive table titles that summarize the investigation including the Records Does not independent & dependent variables (& if appropriate, essential control variables). appropr record b. Includes tables with correct column & row headings. iate any c. The correct units are listed with column & row headings (units should not be included quantit appropri with the raw data). ative ate d. Appropriate uncertainties have been estimated for all raw data & stated with the units data & quantita (in column & row headings). associat tive raw e. All uncertainties are stated as absolute values (not percent) to one significant digit. ed data or qualitat raw data f. Data is recorded with the same precision as the uncertainty (i.e. with the same number of ive raw is decimal places as the uncertainty). * data but incompg. The raw data is appropriate for the research question investigated & logical. Data must with rehensib be collected independently.** some le. h. If significant outliers are present, they are identified in raw data & omitted from Aspect mistake 2. data processing. s or (None of i. Justifies choice of uncertainty (considers precision/uncertainty of equipment plus any omissio the random errors that may significantly affect the variation in data e.g. parallax error when ns. points measuring instruments cannot be clearly aligned with the measurement being made, human are reflex when timing, etc). (Some complet j. Relevant qualitative data that may enhance and support the interpretation of the results of the ed.) has been included. points are omitted .) ASPECT 2. Processing raw data Processes the quantitative raw data correctly &, where relevant, includes uncertainties & error bars. Stu Teac den her t Complete (2 marks) eval che uati ckli on st a. If necessary, processes raw data into a form suitable for graphical representation (e.g. adding, subtracting, averages, % change, rate etc.). b. Processed data is recorded in a correctly formatted table (see aspect 1 above). c. Calculates variation within trials by establishing standard deviation. d. Determines if a significant difference exists between levels of treatment by performing a t-test e. Includes clearly labeled sample calculations for each method of data processing used. (show one sample for each calculation made). f. or if data is already in a form suitable for graphical presentation plots a suitable ‘best-fit’ curve or line graph. DATA COLLECTION & PROCESSING continued on the next page Partial (1 mark) Incompl ete (0 marks) Processe s quantit ative raw data, but with some mistake s &/or omissio ns. No processi ng of quantita tive raw data or major mistakes are made in processi ng. (Some of the points are omitted .) (None of the points are complet ed.) ASPECT 3. Presenting processed data Presents processed data appropriately & where relevant, includes errors and uncertainties. Stu den t Complete (2 marks) che ckli st a. Includes descriptive graph titles that make reference to the independent & dependent variables (& if appropriate, essential control variables). b. For graphs - Both axes are labeled with the correct units. c. For graphs - Scale is even d. For graphs - is sufficiently large (use at least half an A4 page) . e. For graphs - Points are plotted accurately. f. For bar graphs uncertainty in graphical analysis is accounted for by applying error bars which are correctly drawn. Explains under the graph if error bars are not significant for one or both variables. g. For scatter-plot uncertainty in graphical analysis is accounted for by drawing an appropriate line or curve of best fit h. A brief description of trends/relationships observed in graphs is included. Comments: ~ signifies that point was attempted but needs improvement to be considered complete * Point h is a requirement for Aspect 3 if a Conclusion & Evaluation is not submitted for assessment. Copyright: Science & Plants for Schools: www.saps.org.uk Bubbling Cabomba Pondweed - Student Guide (revised 2012) Teac her eval uati on opti onal * Partial (1 mark) Incompl ete (0 marks) Presents processe d data appropr iately, but with some mistake s &/or omissio ns. Presents processe d data inappro priately or incomprehensib ly. (Some of the points are omitted .) (None of the points are complet ed.) ASPECT 3. Improving the investigation (can be discussed with aspects 1 & 2 or in separate section) Suggests realistic improvements for all identified errors, weaknesses and limitations. Student checklis t Complete (2 marks) a. Suggestions on how to remove all systematic errors (if present) are made. b. Suggests how the effect of all random errors could be removed or minimized. [Note: you can nearly always specify – repeat more trials (except when there is a very high level of precision in data/very low uncertainty).] c. Suggest how the control of variables could be improved (to ensure a fairer test of the variables, thus improving the validity of the results). d. Suggests how other significant weaknesses (e.g. management of time, large spread in data, etc.) could be improved. e. Suggests how limitations in the procedure &/or equipment used could be improved (to increase accuracy &/or precision of raw data, and hence, improve the reliability of the trend/relationship observed). f. Improvement of all weaknesses & limitations identified in Aspect 2 are addressed. g. Realistic, clearly specified improvements are suggested. Do not simply state generally that more precise equipment should be used. Copyright: Science & Plants for Schools: www.saps.org.uk Bubbling Cabomba Pondweed - Student Guide (revised 2012) Teacher evaluatio n Partial (1 mark) Suggests only superficial improvements. (Some of the points are omitted.) Incomplete (0 marks) Suggests unrealistic improvements. (None of the points are completed.) Experiment Title: Student name: Submitted to Turn it In for plagiarism check: CONCLUSION & EVALUATION Teacher: Ms. Tyler Total SL Y HL N Date: ASPECT 1. Concluding States a thorough conclusion, with justification, based on a reasonable interpretation of the data. Student checklis t Complete (2 marks) Teacher evaluatio n a. Research question is answered by correctly stating the relationship between the variables b. Conclusion is justified by describing the trends or patterns revealed by the data and by referring to numerical data from processed results. c. States whether the hypothesis is supported or refuted by the data collected in this investigation. d. If known physical quantities were calculated compares the experimental value(s) with the referenced accepted value/s. May choose to calculate the percent discrepancy (error) between experimental and accepted value/s e. If literature is used to determine accepted values then it must be referenced Partial (1 mark) Incomplet e (0 marks) States a conclusion based on reasonable interpretation of the data. States no conclusion or the conclusion based on an unreasonable interpretation of the data. (Some of the points are omitted.) (None of the points are completed.). ASPECT 2. Evaluating procedure for controlling & measuring variables Evaluates experimental weaknesses, limitations & reproducibility. Student checklis t Complete (2 marks) Teacher evaluatio n Partial (1 mark) Incomplet e (0 marks) Identifies some weaknesses & limitations, but the evaluation is weak or missing Identifies irrelevant weaknesses & limitations. Accuracy & Precision f. Accuracy of data collected is discussed. (Note: only required if known quantities were calculated, sources of systematic error were evident or the quality of procedure/equipment used was questionable). g. Precision of data collected is discussed [spread/variation (or uncertainty) in raw data indicated by standard deviation values]. h. Correctly identifies major systematic errors, if present [i.e. if all data points have shifted in same direction ]. The direction of any systematic errors should be specified. i. Correctly identifies sources of random error & discusses whether they had a significant impact on the data collected. Experimental weaknesses and limitations j. Fairness & validity is discussed (i.e. were there any unforeseen control variables / were all control variables kept constant, thus ensuring a fair test that produced valid results, where changes measured in the dependent variable were a true reflection of manipulating the independent variable).* k. Other significant weaknesses (revealed during or after the experiment) are identified (e.g. management of time, large spread in data, etc.). l. Possible causes for any outliers (if identified) are discussed.* m. Significant limitations (apparent before the experiment) in the ‘quality’ of procedure for manipulating & measuring variables is discussed (data range & the number of data points manipulated/measured within the range, number of trials &/or experimental techniques). n. Significant limitations in the equipment used is discussed [precision (& if questionable, accuracy) of equipment]. [Note: precision of equipment essentially refers to the number of decimal places (or power of 10) that could be measured with the instrument.] o. Has some appreciation of the significance of weaknesses & limitations. (List in order of significance.) Reproducibility & reliability of the experiment p. Reproducibility of experiment is discussed i.e. whether another scientist could repeat the experiment & expect to get the same results (Think: whether the method was detailed, explicit & easy to follow; whether the results were precise; and whether the results were accurate). Copyright: Science & Plants for Schools: www.saps.org.uk q. The reliability of the relationship/trend observed Bubbling is discussed (depends on the- Student accuracyGuide & precision of 2012) raw data, & how Cabomba Pondweed (revised close plotted data points are to the line/curve of best fit). CONCLUSION & EVALUATION continued on the next page (Some of the points are omitted.) (None of the points are completed.)

