World Pop Data Sheet Activity
advertisement
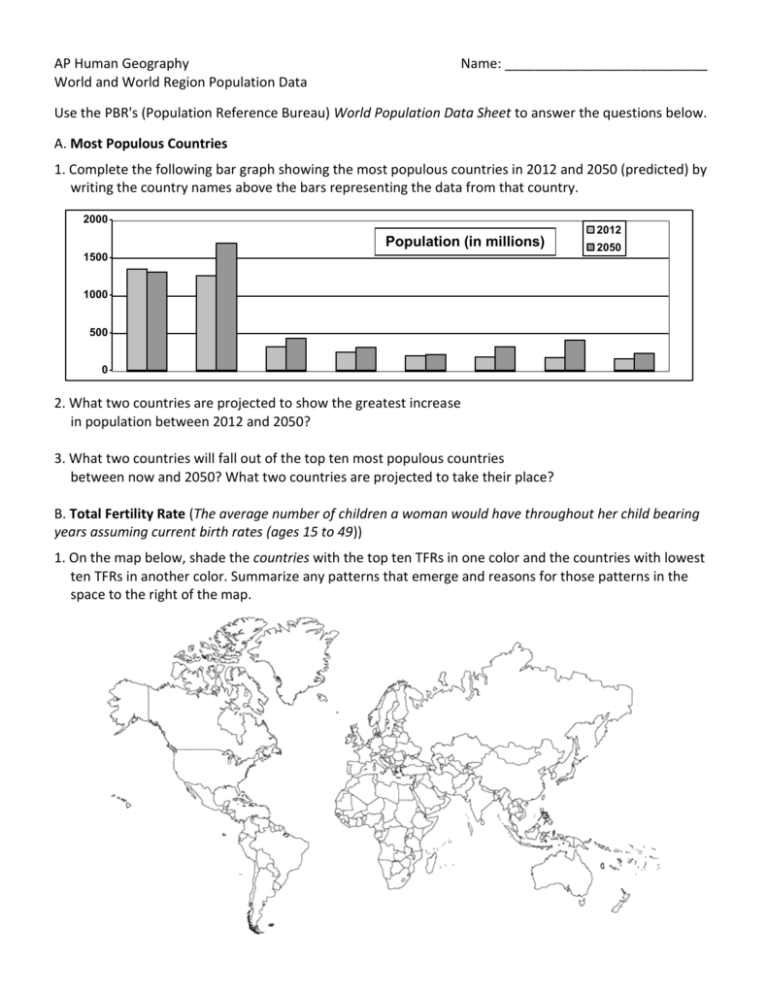
AP Human Geography World and World Region Population Data Name: ___________________________ Use the PBR's (Population Reference Bureau) World Population Data Sheet to answer the questions below. A. Most Populous Countries 1. Complete the following bar graph showing the most populous countries in 2012 and 2050 (predicted) by writing the country names above the bars representing the data from that country. 2000 2012 Population (in millions) 1500 2050 1000 500 0 2. What two countries are projected to show the greatest increase in population between 2012 and 2050? 3. What two countries will fall out of the top ten most populous countries between now and 2050? What two countries are projected to take their place? B. Total Fertility Rate (The average number of children a woman would have throughout her child bearing years assuming current birth rates (ages 15 to 49)) 1. On the map below, shade the countries with the top ten TFRs in one color and the countries with lowest ten TFRs in another color. Summarize any patterns that emerge and reasons for those patterns in the space to the right of the map. C. Population Clock 1. What is the current population of the world? 2. The earth is absorbing the equivalent of 2½ new Santa Barbaras in new people every day. To the nearest million, how many people are currently being added to the world's population every year (i.e. natural increase)? What percentage of that increase is coming from LDCs? 3. To the nearest million, how many infants (usually defined as under 1 year of age) die every year? What percentage of those infant deaths occurs in LDCs? D. Malawi 1. Label Malawi on the outline map on the front of this sheet. 2. What percentage of Malawi's population is under the age of 15? E. Noncommunicable Diseases (NDCs). 1. Give four examples of NDCs and the four greatest risk factors for NDCs. 2. Summarize the trends in NDCs from the text, bar graph, and WHO (World Health Organization) choropleth maps in the PBR data sheet. F. Future Population Growth 1. Summarize the projected future population growth for each of these regions: a. More Developed Countries: b. Less Developed Countries: c. Least Developed Countries: G. U.S. Population Growth 1. How did the age structure of the U.S. change between 2010 and 2011 (which age group(s) saw and increase and which saw a decrease? 2. What are the authors of the PBR data sheet referring to when they write: "The United States still has a great deal of population momentum compared to many other developed countries"? Is this population momentum in the U.S. expected to increase or decrease in the coming years? H. Country and Region Population, Health, and Environmental Data For each of the following demographic category write: the name of the region with the highest value for that category and the value the name of the region with lowest value for that category and the value. the name of the country with the highest value for that category and the value. the name of the country with the lowest value for that category and the value. 1. Crude Birth Rate (Annual number of births per 1,000 population.) high region and value: low region and value: high country and value: low country and value: 2. Crude Death Rate measured (Annual number of deaths per 1,000 population.) high region and value: low region and value: high country and value: low country and value: 3. Infant Mortality Rate (Number of deaths each year to infants under one year of age per 1,000 live births.) high region and value: low region and value: high country and value: low country and value: 4. Total Fertility Rate (Average number of children a woman would have if she maintained today’s level of childbearing throughout her reproductive years.) high region and value: low region and value: high country and value: low country and value: 5. Life Expectancy (The average number of years a newborn infant can expect to live under current mortality levels.) high region and value: low region and value: high country and value: low country and value: 6. Age Structure Under 15: Which region has the "youngest" population, that is, the highest proportion of population under age 15 and what is the value? high region and value: low region and value: high country and value: low country and value: 7. Age Structure Over 65 Which region has the "oldest" population, that is, the highest proportion of population over age 64 and what is the value? high region and value: low region and value: high country and value: low country and value: 8. Natural Increase Rate (The birth rate minus the death rate divided by ten expressed as a percentage) high region and value: low region and value: high country and value: low country and value: 9a. Urbanization (% of the total population living in areas termed “urban” by that country or by the UN.) high region and value: low region and value: high country and value: low country and value: 9b. Which country in each of the following regions has the highest level of urbanization and what is the urbanization % for each of those countries? Africa: Asia: N. America: Latin America: Europe: Oceania: 10. Net Migration Rate (The estimated rate of net immigration (immigration minus emigration per 1,000 population.) high region and value: low region and value: high country and value: low country and value: 11. Contraception Use (The percentage of currently married or “in union” women of reproductive age who are currently using any form of contraception.) high region and value: low region and value: high country and value: low country and value: I. Projected Population by Region 1. Complete this table with the current and projected populations in millions for each of the regions listed: Africa Asia N. America Latin America Europe Oceania 2012 2025 2050 2. What trends are apparent from this data? J. Mapping Population Patterns 1. Shade the defined regions with the colors suggested: highest IMR (black), highest life expectancy (blue), highest NIR (green), slowest NIR (red):
