Teaching Experiment
Reflexes and Reaction Times
In this experiment, you will investigate your reflexes and reaction times in response to a variety of stimuli
and under a variety of conditions. You will examine some simple and complex reflexes from a volunteer, and
look at reaction times from a volunteer given harmless visual and sound cues. You will also study the time
required for a planned voluntary response to a cue.
Written by staff of ADInstruments.
Background
In our day-to-day lives, we detect changes in the environment and react appropriately. An external stimulus
is detected by sensory neurons, which send the information to the central nervous system, where it is
processed. If a motor response is initiated, it usually involves a series of action potentials that produce a
muscle contraction and a movement of one or more parts of the body. Reflexes are examples of this type of
stimulus–response reaction. A loud sound or something flying at your eye makes you blink, while a tap on
the tendon under the kneecap produces the knee-jerk (or myotatic) reflex.
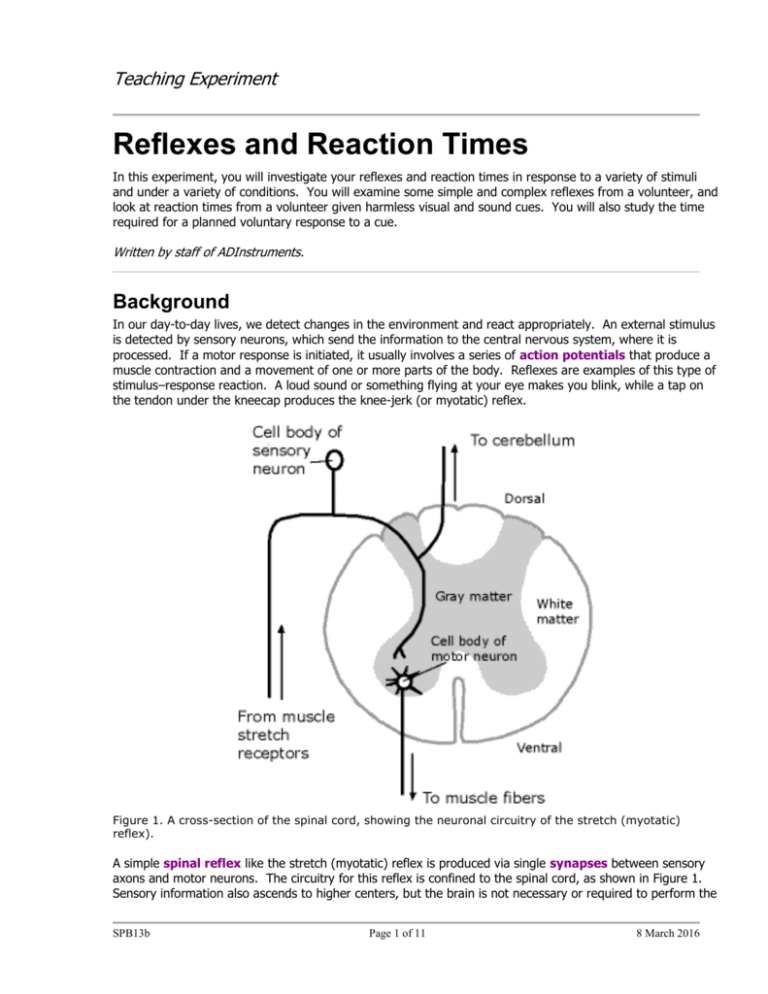
Figure 1. A cross-section of the spinal cord, showing the neuronal circuitry of the stretch (myotatic)
reflex).
A simple spinal reflex like the stretch (myotatic) reflex is produced via single synapses between sensory
axons and motor neurons. The circuitry for this reflex is confined to the spinal cord, as shown in Figure 1.
Sensory information also ascends to higher centers, but the brain is not necessary or required to perform the
SPB13b
Page 1 of 11
8 March 2016
Teaching Experiment
reflex. More complex reflexes usually involve additional cells called interneurons and more than one
population of motor neurons. This results in a longer delay between stimulus and response, and often a more
complex response. An example is the withdrawal reflex, where a noxious stimulus to an arm or leg causes
withdrawal of the stimulated limb, by flexion of several joints.
Voluntary reactions to a cue are considerably more complicated than reflexes: they require higher brain
functions, rather than relying on low-level neuronal circuitry.
Required Equipment
A computer system
Chart software, version 5.0 or later
PowerLab
Timing push-button switch
Finger Pulse Transducer
Small flashlight or other battery-powered light source
Adhesive tape
Optional Equipment
Rubber tendon hammer
Procedures
A. Set up and calibration of equipment
1. Connect the push-button switch to the BNC socket for Channel 1 (Figure 2).
2. Connect the Finger Pulse Transducer to the BNC socket for Channel 2 (Figure 2).
3. You are now ready to begin the exercises. You will not require the PowerLab until Exercise 4.
Figure 2. Equipment setup for measuring reaction time.
SPB13b
Page 2 of 11
8 March 2016
Teaching Experiment
Exercise 1: The stretch reflex
Objectives
To observe the myotatic reflex in a relaxed volunteer, and observe the effects of other activity on the reflex.
Background
Muscles contain special sensory structures, called stretch receptors, which provide signal information about
the length of the muscle as it is stretched. This information is then used to control the position of a joint via
a simple (spinal) reflex. Stretching the muscle activates the stretch receptors, which send impulses to the
spinal cord. Then, excitatory synaptic connections to the motor neurons increase the motor activity of the
muscle, causing it to shorten. This is an example of negative feedback: the original stretch is counteracted
by the reflex tendency to shorten the muscle.
The existence of these neuronal connections can be shown by suddenly causing a small shortening of a
muscle, and observing the resulting active muscle contraction. In medical testing this is done by tapping the
tendon with a special neurological hammer. If you do not have a tendon hammer, with a little practice you
can evoke a stretch reflex by tapping the tendon with your fingers. To get the required force with a brief tap,
you will probably need to press all four fingers of your hand together.
Procedure
1.
Ask the volunteer to sit in a chair and cross the right leg over the left. Check that the right foot can
swing backwards and forwards freely.
2.
Firmly tap the right patellar tendon (just below the knee cap) and watch the knee jerk.
3.
Elicit a series of five knee jerks, at intervals of about two seconds, in order to assess the average
response.
4.
Ask the volunteer to cup and link the fingers of both hands in front of them, and then pull strongly
outwards across their chest (this is the “Jendrassik maneuver”). Repeat step 3 while the volunteer
continues to do this.
Exercise 2: The pupillary light reflex
Objectives
In this exercise, you will observe the pupillary light reflex and related effects in a volunteer.
Background
The retina of the eye is able to respond to differences in light intensity over a very wide range. In bright light,
the eye’s sensitivity is low, but in dark conditions the sensitivity increases. Most of this adaptation occurs in
the photoreceptor cells of the retina, but part of it results from regulation of the amount of light entering the
eye through the pupil.
Procedure
1.
Shade the volunteer’s eyes for about 15 seconds.
2.
Shine a light into one eye and note the response.
3.
Repeat steps 1 and 2, but note the response of the pupil in the unstimulated eye.
4.
With normal lighting, ask the subject to look into the distance, and then at an object held close up
(about 10 cm from the eye). Note the pupil response.
SPB13b
Page 3 of 11
8 March 2016
Teaching Experiment
Exercise 3: Reflex contraction of the palmaris brevis
Objectives
In this experiment, you will observe the reflex contraction of the palmaris brevis muscle.
Background
The flexion withdrawal reflex is not readily studied in human volunteers, because an unpleasantly painful
stimulus is needed to evoke it. However, a little-known reflex involving an obscure muscle in the hand (the
palmaris brevis muscle) exists that shares some features of the flexion reflex and is easily evoked. Everyone
in the group should try this exercise.
Procedure
1. Cup your hand. Note a dimpling of the
skin along the ulnar border (Figure 3).
This dimpling is the action of the palmaris
brevis muscle.
Note: In some people, it is difficult to see
the dimpling of the skin; reflex effects will
be hard to demonstrate.
2. With the palm of your hand facing up
and the hand relaxed, press with your
fingernail over the pisiform bone (Figure 3).
Firm pressure causes a reflex contraction of
the palmaris brevis muscle.
3. Try to find other bony prominences in
the hand at which the reflex can be elicited.
4. Attempt to contract the palmaris brevis
muscle voluntarily, without moving your
little finger. Most people find this difficult
or impossible. However, with extensive
practice the movement can be learned.
Figure 3. Palmar view of the left hand, showing where the
palmaris brevis muscle dimples the skin, and the location of
the pisiform bone.
Exercise 4: Reaction time
Objectives
In this part of the laboratory, you will measure a volunteer’s reaction time to a visual cue.
Procedure
Starting the software
1.
Locate Chart on your computer and start the program.
2.
From the Experiments Gallery dialog box, select “Reflexes and Reaction Time” from the left-hand list.
Select “Reaction Time Settings” from the right-hand list and click the Open button to apply those
settings. If the Experiments Gallery dialog box does not appear in front of the Chart window, choose
the Experiments Gallery… command from the File menu.
SPB13b
Page 4 of 11
8 March 2016
Teaching Experiment
3.
After a short time, the Chart window on the computer screen should be set up for the next exercises.
One channel should be visible: Channel 1 should be named “Response”. Channel 2 is hidden at the
bottom of the data display area.
4.
The settings file configures Chart so that recording does not start immediately after the Start button is
clicked. Instead, the PowerLab waits for a trigger event in the form of a signal from the Finger Pulse
Transducer, such as that produced by lightly tapping the transducer. This signal is recorded on Channel
2, but not used in your analysis.
5.
After the PowerLab is triggered, Chart will record for 0.5 s, which is long enough for a press of the pushbutton switch to be recorded in the “Response” channel. Chart will record up to ten blocks of data using
this trigger method. After the tenth block of data, the Start/Stop button will behave normally. Reaction
times are measured as the time from the start of each data block to the recorded signal from the pushbutton switch.
Measuring reaction time
1.
Wrap the Velcro strap around the Finger Pulse Transducer to cover its diaphragm. This protects the
transducer against hard tapping. Place the transducer on the laboratory bench with the diaphragm
facing up, in a place where it will not be bumped accidentally. Keep the transducer in place with a piece
of adhesive tape across the cable.
2.
Instruct the volunteer to click the push-button switch as soon as they see you tap the transducer.
3.
Hold one hand just over the transducer, but not touching it. Click the Start button. The system will begin
recording when it receives a signal from the transducer.
4.
After a delay of 1 to 4 seconds, tap the transducer without warning the volunteer.
5.
Repeat steps three and four a total of ten times, ensuring that the taps are given without warning, at
unpredictable intervals in the range of 1 to 4 seconds.
6.
Recording stops automatically after ten data blocks have been recorded.
7.
Save your data file for later analysis.
Exercise 5: Reaction time with a warning
Objectives
In this part of the experiment, you will measure the reaction time to a visual cue given immediately after a
verbal prompt.
Procedure
1.
After you have saved the data from Exercise 4, close the file window and select “New” from the File
menu.
2.
Repeat Exercise 4, but warn the volunteer verbally of each cue by saying “ready”, immediately before
tapping the transducer.
3.
Save your data file for later analysis.
SPB13b
Page 5 of 11
8 March 2016
Teaching Experiment
Exercise 6: Reaction time to predictable clues
Objectives
In this part of the laboratory, you will measure the volunteer’s reaction time to a cue given at regular
intervals.
Procedure
1.
After you have saved the data from Exercise 5, close the file window and select “New” from the File
menu.
2.
Repeat Exercise 4, with no verbal warning, but instead tap the transducer in a regular rhythm, such as
every 2 seconds.
3.
Save your data for later analysis.
Exercise 7: Reaction time with a distracting task
Objectives
In this exercise, you will measure the volunteer’s reaction time while they are doing mental arithmetic.
Procedure
1.
After you have saved the data from Exercise 6, close the file window and select “New” from the File
menu.
2.
Ask the volunteer to count down from 100 by 7, i.e., starting from 100 and subtracting 7 repeatedly.
Have them try to count as fast as possible. The volunteer should say each number aloud (100, 93,
86…).
3.
While the volunteer is doing the mental arithmetic, repeat Exercise 4.
4.
Save your data for later analysis.
Exercise 8: Reaction time to auditory cues
Objectives
In this exercise, you will measure the volunteer’s reaction time to sound.
Procedure
1.
Have the volunteer face away from both the finger pulse transducer and the computer screen to avoid
visual cues. They should be close enough to hear a vigorous tap on the transducer.
2.
Experiment with different ways of tapping, to find one which gives a sound that can be clearly heard by
the volunteer, but without risk of damaging the transducer. Try tapping the bench and the transducer
simultaneously. Alternatively, cover the transducer with a piece of folded paper, and flick it sharply.
3.
After you have saved the data from Exercise 7, close the file window and select “New” from the File
menu.
4.
Repeat Exercise 4, with the volunteer reacting to sound.
5.
Save your data for analysis.
SPB13b
Page 6 of 11
8 March 2016
Teaching Experiment
Analysis
Exercise 1: The stretch reflex
Record your observations in your Data Notebook.
Exercise 2: The pupillary light reflex
Record your observations in your Data Notebook.
Exercise 3: Reflex contraction of the palmaris brevis
Record your observations in your Data Notebook.
Exercise 4: Reaction time
Manual Analysis
1.
Select the first event and choose Zoom window from the Window menu.
2.
Move the Waveform Cursor until it is over the start of the response in the Zoom window, and read
the time value from the region of the window just below the title bar. This reaction time is the time
from the stimulus (at time zero) to the response signal (the time value t = 0.147 s in Figure 4).
Repeat the measurement for all ten trials.
Figure 4. Measurement of reaction time. The Chart View window shows a
series of responses, one of which is selected and enlarged in the Zoom
window. Place the cursor at the start of the response pulse to get the
reaction time.
SPB13b
Page 7 of 11
8 March 2016
Teaching Experiment
3.
Omit the longest and shortest values and average the remaining eight values to give the mean reaction
time. Record your result in Table 1 of the Data Notebook.
Automated Analysis
After you have manually analyzed the data, you can try to have Chart analyze your data for you. You will
use this procedure to analyze the data from Exercises 5-8.
1.
Select “Reaction Times” from the Macro menu. This command will automate steps 1 to 3 above and
presents the ten results in a column of the Data Pad window.
2.
Check that there are exactly ten results. If there are more than ten, it means that you forgot to discard
some previous data. Repeat the exercise to get exactly ten blocks of data in your recording and save
the file.
3.
Omit the longest and shortest values shown in the Data Pad, and using a calculator, average the
remaining eight values to give the mean reaction time. Record your result in Table 1 of the Data
Notebook.
4.
You should get an almost identical result from the two methods of data analysis, except for the units of
time — one may be expressed in seconds (for example 0.147 s) and the other in milliseconds (147 ms).
The results may differ slightly in the third digit.
Exercises 5-8: Reaction time under different conditions
1.
For each data file, use the automated analysis procedure described above.
2.
Record the average reaction time in Table 1 of your Data Notebook.
Data Notebook
Exercise 1: The stretch reflex
Record your observations from Exercise 1 in the space below.
Stretch reflex alone:
SPB13b
Page 8 of 11
8 March 2016
Teaching Experiment
Stretch reflex with Jendrassik maneuver:
Exercise 2: The pupillary light reflex
Record your observations from Exercise 2 in the space below.
Response of eye to light:
Response of non-illuminated eye:
Response of eye to focusing on a near object:
Exercise 3: Reflex contraction of the palmaris brevis
Record your observations from Exercise 3 in the space below.
SPB13b
Page 9 of 11
8 March 2016
Teaching Experiment
Table 1: Results from the reaction time experiments
Experimental Condition
Average Reaction Time (s)
Standard (manual calculation)
Standard (automated calculation)
Verbal warning
Predictable cues
Distracting task
Auditory cues
Study Questions
1.
What effect does the Jendrassik maneuver have on the knee-jerk reflex?
2.
What is the response of the pupil when light is shined on it?
3.
What was the response of the pupil in the opposite eye?
4.
What happens to pupil diameter when the eye is focused for near vision?
SPB13b
Page 10 of 11
8 March 2016
Teaching Experiment
5.
Is the mean reaction time the same under all conditions?
6.
Which conditions increase the reaction time, and which decrease it?
7.
Do you think that the difference in reaction time between auditory and visual cues is really due to
different processing times in the brain?
8.
Could the difference in reaction times just be due to inherent variability in the experimental method?
Copyright © 2004 ADInstruments. All rights reserved.
MacLab and PowerLab are registered trademarks, and Chart and Scope are trademarks, of ADInstruments. Windows and the
Windows logo are either trademarks or registered trademarks of Microsoft Corporation. Macintosh and the
Mac logo are either trademarks or registered trademarks of Apple Computer, Inc. Other trademarks are the properties of their
respective owners.
www.ADInstruments.com
SPB13b
Page 11 of 11
8 March 2016

