Managerial Accounting: Analyzing Financial Statements
advertisement
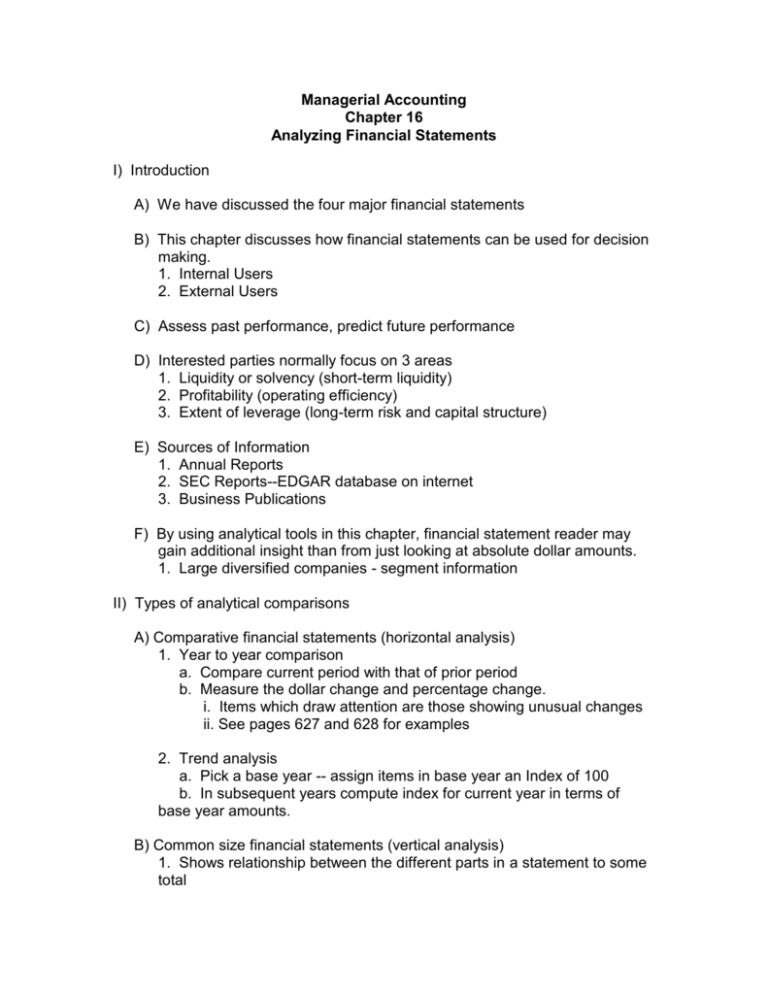
Managerial Accounting Chapter 16 Analyzing Financial Statements I) Introduction A) We have discussed the four major financial statements B) This chapter discusses how financial statements can be used for decision making. 1. Internal Users 2. External Users C) Assess past performance, predict future performance D) Interested parties normally focus on 3 areas 1. Liquidity or solvency (short-term liquidity) 2. Profitability (operating efficiency) 3. Extent of leverage (long-term risk and capital structure) E) Sources of Information 1. Annual Reports 2. SEC Reports--EDGAR database on internet 3. Business Publications F) By using analytical tools in this chapter, financial statement reader may gain additional insight than from just looking at absolute dollar amounts. 1. Large diversified companies - segment information II) Types of analytical comparisons A) Comparative financial statements (horizontal analysis) 1. Year to year comparison a. Compare current period with that of prior period b. Measure the dollar change and percentage change. i. Items which draw attention are those showing unusual changes ii. See pages 627 and 628 for examples 2. Trend analysis a. Pick a base year -- assign items in base year an Index of 100 b. In subsequent years compute index for current year in terms of base year amounts. B) Common size financial statements (vertical analysis) 1. Shows relationship between the different parts in a statement to some total a. Such as current assets to total assets b. See pages 629 and 630. 2. On Income Statement every item is expressed as a percentage of net sales. 3. On Balance Sheet each item is expressed as a percentage of total assets. 4. Common size statements help point out efficiencies or inefficiencies that may be hard to see. a. Also good for comparing companies of different size. C) Current period statements compared with budgets D). Ratio Analysis -- examine the mathematical relationship between two items. 1. Solvency (liquidity) Ratios -- measure a firm's ability to pay short term debts. a. Current Ratio = Current Assets ------------------------Current Liabilities i) Current Assets - Current Liabilities = Working Capital b. Quick or Acid Test Ratio = Cash + Short-term Investments + Receivables (net) -------------------------------------------------------------------Current Liabilities c. Receivables Turnover = Net (credit) Sales --------------------------------------Average Accounts Receivable 1. Number of Days Sales Uncollected = (also known as average collection period) Days in Year -----------------------------Receivable Turnover or Days Sales Uncollected = Accounts Receivable Accounts Receivable ------------------------------------------ or ---------------------------- X 365 Daily Sales Net Sales d. Inventory Turnover = Cost of Goods Sold Average Inventory 1. Days sales in inventory Days in year Ending Inventory Ending Inventory ----------------------- Or ------------------------- Or -----------------------X 365 Inventory Turnover Daily COGS COGS e. Debt to Equity ratio = Total Liabilities Total Stockholder’s Equity 2. Profitability Ratios -- How profitable is the entity? Is entity operating efficiently? a. Profit Margin = Net Income --------------------Sales (Revenues) b. Total Asset Turnover (net sales to assets) = Net Sales ------------------------------------------------------------------------Average Total Assets (excluding long-term investments). c. Return on Total Assets = Net Income + Interest Expense ---------------------------------------------Average Total Assets d. Return on Stockholder’s Equity = Net Income ---------------------------------Average Stockholder’s Equity e. Return on Common Equity = Net Income - preferred dividends -----------------------------------------------------Average Common Stockholders' Equity f. Earnings per share = Net income to common shareholders -----------------------------------------------------------------------------weighted average number of common shares outstanding. g. Price Earnings Ratio -- How much are investors willing to pay for $1 EPS. Price Earning Ratio = Market price per share --------------------------------Earnings per share h. Payout Ratio -- How much the earnings are being paid out as dividends. Payout Ratio = Cash dividends ---------------------Net Income. i. Dividend Yield = What is the rate of return from dividend payments. Dividend Yield = Annual dividends per share -----------------------------------Market price per share j. Times Interest Earned (Interest coverage) = Income before interest and taxes ---------------------------------------------Interest Expense III) Limitations of Ratio Analysis A) Must be compared to something B) Snapshot of company at one point in time. C) Accounting data subject to different interpretations (quality of earnings) D) When using "averages" for comparison, make sure you know how (what formula) was used for computing the average. E) Use of estimates in financial statements.
