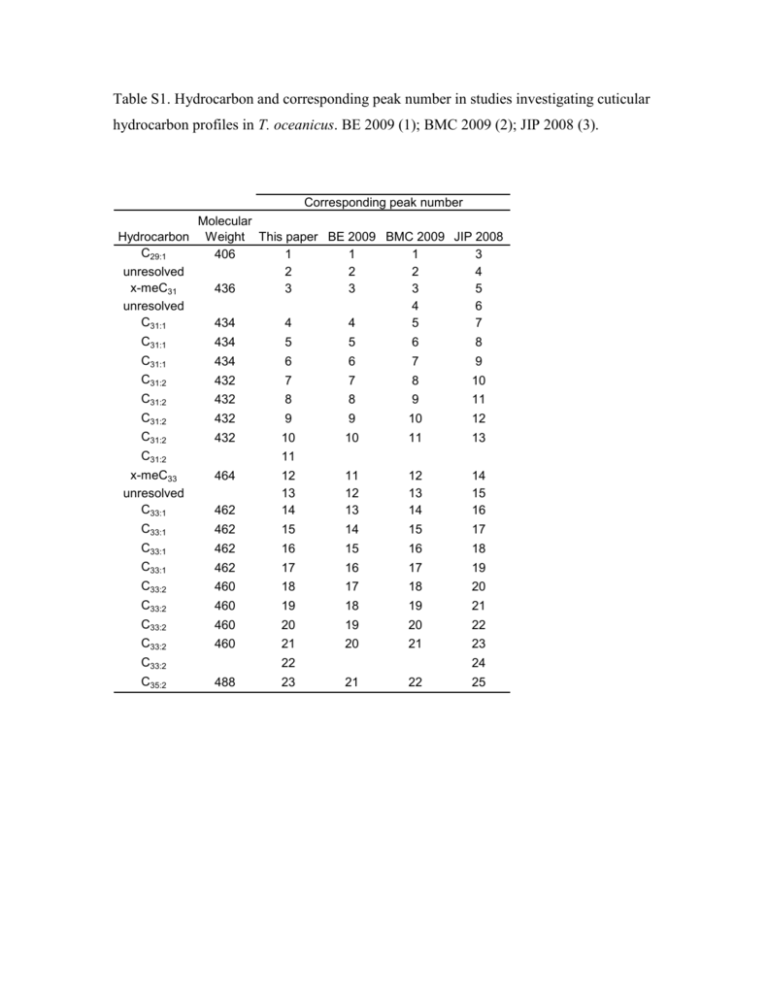
Table S1. Hydrocarbon and corresponding peak number in studies investigating cuticular
hydrocarbon profiles in T. oceanicus. BE 2009 (1); BMC 2009 (2); JIP 2008 (3).
Corresponding peak number
Molecular
Hydrocarbon Weight This paper BE 2009 BMC 2009 JIP 2008
C29:1
406
1
1
1
3
unresolved
2
2
2
4
x-meC31
436
3
3
3
5
unresolved
4
6
C31:1
434
4
4
5
7
C31:1
434
5
5
6
8
C31:1
434
6
6
7
9
C31:2
432
7
7
8
10
C31:2
432
8
8
9
11
C31:2
432
9
9
10
12
C31:2
432
10
10
11
13
11
12
13
12
13
14
14
15
16
C31:2
11
x-meC33
unresolved
C33:1
464
462
12
13
14
C33:1
462
15
14
15
17
C33:1
462
16
15
16
18
C33:1
462
17
16
17
19
C33:2
460
18
17
18
20
C33:2
460
19
18
19
21
C33:2
460
20
19
20
22
C33:2
460
21
20
21
23
21
22
C33:2
C35:2
22
488
23
24
25
Table S2. The relative concentration of 23 cuticular hydrocarbon peaks identified from
SPME of dominant and subordinate male T. oceanicus following the initial dominance
ranking. Peaks that contribute significantly to PC1 are in bold.
Concentration (% ± S.E.)
Peak
Retention
time
1
2
3
4
5
6
7
8
9
10
11
12
13
14
15
16
17
18
19
20
21
22
23
11.310
11.670
11.930
12.010
12.170
12.470
12.520
12.580
12.630
12.730
12.840
12.880
13.310
13.530
13.690
13.780
14.120
14.170
14.230
14.330
14.420
14.550
16.540
Hydrocarbon
Dominant
Subordinate
C29:1
2.06 ± 0.11
0.80 ± 0.22
8.27 ± 0.40
0.42 ± 0.07
0.99 ± 0.09
10.15 ± 0.51
0.99 ± 0.10
0.71 ± 0.15
3.45 ± 0.17
21.43 ± 1.04
4.67 ± 0.42
0.70 ± 0.13
0.32 ± 0.05
2.16 ± 0.15
0.53 ± 0.03
5.32 ± 0.27
0.39 ± 0.10
1.03 ± 0.11
1.47 ± 0.07
7.67 ± 0.44
24.69 ± 1.05
1.44 ± 0.10
0.39 ± 0.08
1.95 ± 0.13
0.68 ± 0.11
7.30 ± 0.33
0.48 ± 0.06
0.94 ± 0.09
9.73 ± 0.38
1.22 ± 0.13
0.42 ± 0.11
3.23 ± 0.21
21.10 ± 1.27
4.54 ± 0.31
0.84 ± 0.17
0.38 ± 0.05
2.40 ± 0.29
0.51 ± 0.04
5.30 ± 0.27
0.36 ± 0.10
1.08 ± 0.11
1.51 ± 0.06
7.45 ± 0.37
26.36 ± 0.81
1.77 ± 0.13
0.39 ± 0.07
unresolved
x-meC31
C31:1
C31:1
C31:1
C31:2
C31:2
C31:2
C31:2
C31:2
x-meC33
unresolved
C33:1
x-meC33
C33:1
C33:1
C33:2
C33:2
C33:2
C33:2
C33:2
C35:2
Table S3. Correlations between the relative concentrations of cuticular hydrocarbon
peaks taken after the initial dominance ranking, and the five components extracted from
the principal components analysis. The percentage of variance explained for components
1-5 were 32.41, 17.44, 16.23, 8.45 and 4.68 percent respectively. Following the criteria of
Mardia (4) peaks that contribute significantly to each PC are in bold.
PEAK
1
2
4
5
6
7
8
9
10
11
12
RT
11.31
11.67
12.01
12.17
12.47
12.52
12.58
12.63
12.73
12.84
12.88
Hydrocarbon
unresolved
unresolved
C31:1
C31:1
C31:1
C31:2
C31:2
C31:2
C31:2
C31:2
C33
PC1
0.61
0.07
0.50
0.35
0.37
0.60
-0.36
0.54
0.37
0.06
0.57
PC2
0.28
0.15
0.39
-0.23
0.53
0.26
0.36
0.56
0.85
0.91
-0.43
PC3
0.29
0.60
-0.47
0.66
0.03
-0.19
0.65
-0.17
-0.16
0.14
-0.51
PC4
-0.26
-0.14
-0.09
-0.11
0.53
0.38
0.39
-0.46
-0.09
0.26
0.18
PC5
0.13
-0.59
0.39
-0.02
-0.29
-0.30
0.03
0.17
-0.04
0.10
-0.05
13
14
13.31
13.53
unresolved
C33:1
0.64
0.38
0.18
-0.50
-0.44
-0.14
0.30
0.60
0.02
0.20
15
16
13.69
13.78
unresolved
C33:1
0.67
0.80
0.11
-0.32
0.48
0.33
-0.29
-0.09
0.11
0.15
17
18
19
20
21
22
23
14.12
14.17
14.23
14.33
14.42
14.55
16.54
unresolved
C33:2
C33:2
C33:2
C33:2
C33:2
C35:2
-0.26
0.77
0.78
0.81
0.91
0.65
0.43
0.31
-0.13
0.14
-0.11
-0.12
-0.20
-0.64
0.70
-0.43
-0.10
0.30
0.25
0.45
0.31
0.29
-0.02
-0.03
-0.25
0.02
0.40
0.05
0.27
-0.22
-0.14
-0.13
0.05
0.24
-0.04
RT, retention time; PC, principal component.
Table S4. Correlations between the mean difference in individual peaks ((Day 1 - Day 2)
± S.E.)-2 following the social challenge, and the six components extracted from the
principal components analysis. The percentage of variance for components 1-6 was
33.47, 15.73, 9.24, 7.01, 6.31 and 5.86 percent respectively. Peaks that contribute
significantly to each PC are in bold. RT, retention time; PC, principal component.
PEAK
1
2
4
5
6
7
8
9
10
11
12
RT
11.31
11.67
12.01
12.17
12.47
12.52
12.58
12.63
12.73
12.84
12.88
Hydrocarbon
unresolved
unresolved
C31:1
C31:1
C31:1
C31:2
C31:2
C31:2
C31:2
C31:2
C33
13
14
13.31
13.53
unresolved
C33:1
15
16
13.69
13.78
unresolved
C33:1
17
18
19
20
21
22
23
14.12
14.17
14.23
14.33
14.42
14.55
16.54
unresolved
C33:2
C33:2
C33:2
C33:2
C33:2
C35:2
PC1
0.792
0.348
0.579
0.484
0.534
0.460
0.403
0.622
0.602
0.492
0.022
0.590
0.232
0.842
0.899
0.360
0.633
0.335
0.863
0.949
0.837
0.578
PC2
-0.203
0.044
-0.287
0.314
-0.386
-0.023
-0.173
-0.303
-0.694
-0.733
0.788
0.096
0.760
0.023
0.252
0.130
0.381
-0.151
0.318
0.251
0.299
0.667
PC3
-0.075
0.020
-0.543
0.174
0.639
-0.171
0.769
-0.453
-0.083
0.383
-0.155
-0.389
0.292
-0.293
-0.200
0.540
-0.195
-0.138
-0.184
0.048
0.350
-0.015
PC4
-0.043
-0.402
0.112
-0.409
0.122
0.324
0.222
-0.121
0.261
0.138
0.238
0.550
0.012
-0.274
-0.272
-0.280
-0.043
0.582
-0.052
-0.095
-0.184
-0.079
PC5
-0.111
0.616
-0.136
0.593
0.180
0.378
0.067
0.066
0.189
0.218
0.065
-0.177
-0.113
0.126
0.109
-0.167
0.060
-0.020
0.156
0.057
0.019
-0.135
PC6
-0.111
0.641
-0.229
0.161
-0.317
0.054
-0.398
0.164
-0.007
-0.321
0.269
0.152
-0.204
-0.142
0.025
0.072
-0.189
0.587
0.081
0.115
-0.032
0.327
References
1.
2.
3.
4.
Thomas ML, Simmons LW. Male dominance influences pheromone expression,
ejaculate quality, and fertilization success in the Australian field cricket,
Teleogryllus oceanicus. Behav Ecol. 2009;20:1118-24.
Thomas ML, Simmons LW. Sexual selection on cuticular hydrocarbons in the
Australian field cricket, Teleogryllus oceanicus. BMC Evol Biol. 2009;9(1):16273.
Thomas ML, Simmons LW. Sexual dimorphism in cuticular hydrocarbons of the
Australian field cricket Teleogryllus oceanicus (Orthoptera: Gryllidae). Journal of
Insect Physiology. 2008;54:1081-9.
Mardia KV, Kent JT, Bibby JM. Multivariate Analysis. London: Academic Press;
1979.

