Data Worksheet
Name Date
Comparative Economic Systems
Economic Systems
The institutional
:
What would life be like in the North Korean economy? framework of formal and informal rules that a society uses to determine
How would things be different in the economy of Chad?
Why is Liechtenstein so wealthy? what to produce, how to produce and how to distribute goods and services.
In this lesson, you will have the opportunity to compare these three economie s to the U.S. economy, and you’ll practice using some tools that can help you to study any economy in the world.
1. Complete the data worksheet by using the CIA World Factbook at https://www.cia.gov/library/publications/the-world-factbook/index.html
If you copy and paste answers – format text appropriately to ensure readability on final copy
(suggested 8 pt. Arial font)
2. Answer the seven reflection questions after gathering the data.
3. Complete the assignment online and post to your weebly website
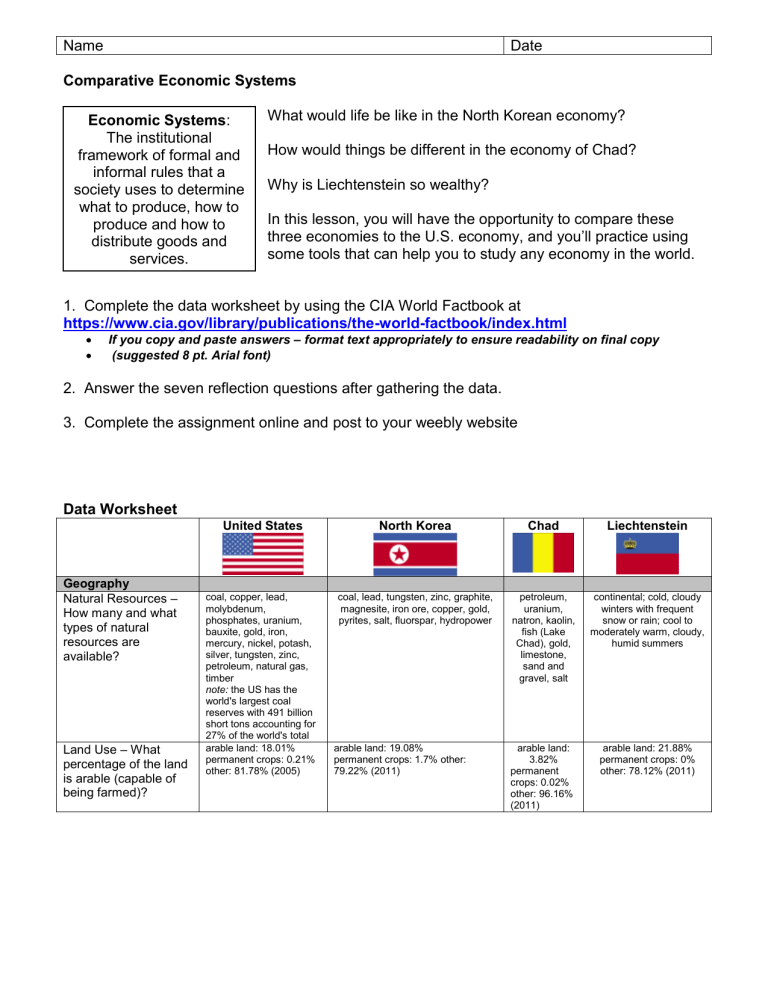
Data Worksheet
United States North Korea Chad Liechtenstein
Geography
Natural Resources –
How many and what types of natural resources are available?
Land Use – What percentage of the land is arable (capable of being farmed)?
coal, copper, lead, molybdenum, phosphates, uranium, bauxite, gold, iron, mercury, nickel, potash, silver, tungsten, zinc, petroleum, natural gas, timber note: the US has the world's largest coal reserves with 491 billion short tons accounting for
27% of the world's total arable land: 18.01% permanent crops: 0.21% other: 81.78% (2005) coal, lead, tungsten, zinc, graphite, magnesite, iron ore, copper, gold, pyrites, salt, fluorspar, hydropower arable land: 19.08% permanent crops: 1.7% other:
79.22% (2011) petroleum, uranium, natron, kaolin, fish (Lake
Chad), gold, limestone, sand and gravel, salt arable land:
3.82% permanent crops: 0.02% other: 96.16%
(2011) continental; cold, cloudy winters with frequent snow or rain; cool to moderately warm, cloudy, humid summers arable land: 21.88% permanent crops: 0% other: 78.12% (2011)
Government
Spending as
Percent of GDP
(Budget
Expenditures
Divided by
GDP). Find in
Economy section
Military
Spending as a
Percentage of
GDP. Find in
Military section
Economy
Economy
Overview –
What are the most serious economic problems facing each of these four nations?
Summarize from Economic
Overview
Name
People
Life Expectancy at Birth – How long are children born today expected to live? total population:
78.11 years country comparison to the world: 49 male: 75.65 years female: 80.69 years (2009 est.) total population: 69.51 years country comparison to the world: 155 male: 65.65 years female: 73.55 years (2013 est.)
Total Fertility
Rate – How many children does each woman have, on average?
Literacy Rate –
What % of people over the age of 15 can read and write?
Date
total population: 49.07 years country comparison to the world: 223 male: 47.95 years female: 50.22 years (2013 est.)
2.05 children born/woman (2009 est.) country comparison to the world: 126
1.99 children born/woman (2013 est.) country comparison to the world: 131
4.8 children born/woman (2013 est.) country comparison to the world: 24 definition: age 15 and over can read and write French or Arabic total population: 35.4% male: 45.6% female: 25.4% (2011 est.)
Government
Government
Type –How are leaders elected? definition: age 15 and over can read and write total population:
99% male: 99% female: 99% (2003 est.)
Constitution-based federal republic; strong democratic tradition
GDP (PPP): $14.26 trillion (2009 est.)
Budget: revenues:
$1.914 trillion expenditures:
$3.615 trillion
(2009 est.)
$3.615 trillion /
$14.26 trillion = .25
(25%)
4.06% of GDP
(2005 est.) country comparison to the world: 28 definition: age 15 and over can read and write total population: 100% male: 100% female: 100% (2008 est.)
Communist state one-man dictatorship
$40 billion (2011 est.) country comparison to the world: 104
$40 billion (2010 est.)
$40 billion (2009 est.) note: data are in 2011 US dollars;
NA
Long-term problems include inadequate investment in economic infrastructure, rapidly rising medical and pension costs of an aging population, sizable trade and budget deficits, and stagnation of family income in the lower economic groups.
North Korea, one of the world's most centrally directed and least open economies, faces chronic economic problems. Industrial capital stock is nearly beyond repair as a result of years of underinvestment, shortages of spare parts, and poor maintenance. Large-scale military spending draws off resources needed for investment and civilian consumption. Industrial and power output have stagnated for years at a fraction of pre-1990 levels. Frequent weather-related crop failures aggravated chronic food shortages caused by ongoing systemic problems, including a lack of arable land, collective farming practices, poor soil quality, insufficient fertilization, and persistent shortages of tractors and fuel. Large-scale international food aid deliveries as well as aid from China has allowed the people of North Korea to escape widespread starvation since famine threatened in 1995, but the population continues to suffer from prolonged malnutrition and poor living conditions. Since 2002, the government has allowed private "farmers' markets" to begin selling a wider range of goods. It also permitted some private farming - on an experimental basis - in an effort to boost agricultural output. In December 2009, North Korea carried out a redenomination of its currency, capping the amount of North Korean won that could be exchanged for the new notes, and limiting the exchange to a one-week window. A concurrent crackdown on markets and foreign currency use yielded severe shortages and inflation, forcing
Pyongyang to ease the restrictions by February
2010. In response to the sinking of the South
Korean destroyer Cheonan and the shelling of
Yeonpyeong Island, South Korea's government cut republic
$21 billion (2012 est.) country comparison to the world: 129
$19.99 billion (2011 est.)
$19.89 billion (2010 est.) note: data are in 2012 US dollars
Chad's primarily agricultural economy will continue to be boosted by major foreign direct investment projects in the oil sector that began in 2000. Economic conditions have been positive in recent years, with real GDP growth reaching 13% in 2010 because of high international prices for oil and a strong local harvest. GDP growth for
2012 was 5%. However, Chad's investment climate remains challenging due to limited infrastructure, a lack of trained workers, extensive government bureaucracy, and corruption. At least 80% of Chad's population relies on subsistence farming and livestock raising for its livelihood. The government of Chad is determined to improve agricultural production through modernization and mechanization over the next three years, and hosted a national Rural Development
Forum in 2012 to promote investment in agriculture. Chad's economy has long been handicapped by its landlocked position, high energy costs, and a history of instability. Chad relies on foreign assistance and foreign capital for most public and private sector investment projects. Remittances are also an important source of income. The Libyan total population:
81.59 years country comparison to the world: 12 male: 79.45 years female: 84.29 years
(2013 est.)
1.69 children born/woman (2013 est.) country comparison to the world: 171 definition: age 10 and over can read and write total population:
100% male: 100% female: 100% hereditary constitutional monarchy
Despite its small size and limited natural resources, Liechtenstein has developed into a prosperous, highly industrialized, free-enterprise economy with a vital financial service sector and likely the second highest per capita income in the world. The
Liechtenstein economy is widely diversified with a large number of small businesses. Low business taxes - the maximum tax rate is 20%
- and easy incorporation rules have induced many holding companies to establish nominal offices in
Liechtenstein providing 30% of state revenues. The country participates in a customs union with Switzerland and uses the Swiss franc as its national currency. It imports more than 90% of its energy requirements.
Liechtenstein has been a member of the European Economic Area (an organization serving as a bridge between the European Free Trade
Association (EFTA) and the EU) since May 1995. The government is working to harmonize its economic policies with those of an integrated
Europe. Since 2008, Liechtenstein has faced renewed international pressure - particularly from Germany
- to improve transparency in its
Name
GDP Per Capita
– What is the value of goods and services produced per person?
Population
Below Poverty
Line – How many people live in poverty?
GDP
Composition by
Sector – What % of GDP is industry and services?
Labor Force by
Occupation –
What
% of workers is in agriculture?
$46,400 (2009 est.) country comparison to the world: 11
12% (2004 est.) agriculture: 1.2% industry: 21.9% services: 76.9%
(2009 est.) farming, forestry, and fishing: 0.7%
Industries –
What are the primary industries?
Are the industries primarily producing for consumer or government consumption?
Determine this by assessing the industries and their consumers – answer not found at CIA
WorldFactBook leading industrial power in the world, highly diversified and technologically advanced; petroleum, steel, motor vehicles, aerospace, telecommunication s, chemicals, electronics, food processing, consumer goods, lumber, mining
Mostly producing for the consumer
(private citizens) off most aid, trade, and bilateral cooperation activities, with the exception of operations at the
Kaesong Industrial Complex. In 2012, KIM Jong
Un's first year of leadership, the North displayed increased focus on the economy by renewing its commitment to special economic zones with China, negotiating a new payment structure to settle its
$11 billion Soviet-era debt to Russia, and purportedly proposing new agricultural and industrial policies to boost domestic production. The
North Korean government often highlights its goal of becoming a "strong and prosperous" nation and attracting foreign investment, a key factor for improving the overall standard of living.
Nevertheless, firm political control remains the government's overriding concern, which likely will inhibit fundamental reforms of North Korea's current economic system.
$1,800 (2011 est.) country comparison to the world: 197
$1,800 (2010 est.)
$1,900 (2009 est.) note: data are in 2011 US dollars
N/A % agriculture: 23.3% industry: 42.9% services: 33.8% (2012 est.)
12.2 million country comparison to the world: 43 note: estimates vary widely
(2009 est.) world: 88
Date
conflict disrupted inflows of remittances to
Chad's impoverished western region that relies on income from Chadians living in
Libya. A consortium led by two US companies has been investing $3.7 billion to develop oil reserves - estimated at 1.5 billion barrels - in southern Chad. Chinese companies are also expanding exploration efforts and have completed a 311-km pipeline and the country's first refinery. The nation's total oil reserves are estimated at
1.5 billion barrels. Oil production came on stream in late 2003. Chad began to export oil in 2004. Cotton, cattle, and gum arabic provide the bulk of Chad's non-oil export earnings.
$2,000 (2012 est.) country comparison to the world: 194
$1,900 (2011 est.)
$1,900 (2010 est.) note: data are in 2012 US dollars
80% (2001 est.) NA banking and tax systems. In
December 2008, Liechtenstein signed a Tax Information Exchange
Agreement with the US. Upon
Liechtenstein's conclusion of 12 bilateral information-sharing agreements, the OECD in October
2009 removed the principality from its
"grey list" of countries that had yet to implement the organization's Model
Tax Convention. By the end of 2010,
Liechtenstein had signed 25 Tax
Information Exchange Agreements or
Double Tax Agreements. In 2011
Liechtenstein joined the Schengen area, which allows passport-free travel across 26 European countries .
$89,400 (2009 est.) country comparison to the world: 2
$90,600 (2008 est.)
$89,700 (2007 est.) agriculture: 47.1% industry: 9.2% services: 43.7% (2012 est.)
4.293 million (2007) country comparison to the military products; machine building, electric power, chemicals; mining (coal, iron ore, limestone, magnesite, graphite, copper, zinc, lead, and precious metals), metallurgy; textiles, food processing; tourism oil, cotton textiles, meatpacking, brewing, natron (sodium carbonate), soap, cigarettes, construction materials
Government consumption Consumer consumption agriculture: 8% industry: 37% services: 55% (2009)
35,250 (2010) country comparison to the world: 201 note: 51% of the labor force in Liechtenstein commuted daily from
Austria, Switzerland, or
Germany (2012) electronics, metal manufacturing, dental products, ceramics, pharmaceuticals, food products, precision instruments, tourism, optical instruments
Consumer consumption
Name Date
Agriculture
Products – What are the primary agricultural goods produced?
Industrial
Production
Growth Rate
Electricity
Production wheat, corn, other grains, fruits, vegetables, cotton; beef, pork, poultry, dairy products; fish; forest products
-5.5% (2009 est.) country comparison to the world: 110 rice, corn, potatoes, soybeans, pulses; cattle, pigs, pork, eggs
Na cotton, sorghum, millet, peanuts, rice, potatoes, manioc
(tapioca); cattle, sheep, goats, camels
10.6% (2012 est.) country comparison to the world: 8 wheat, barley, corn, potatoes; livestock, dairy products
NA
4.11 trillion kWh
(2008 est.) country comparison to the world: 1
20.45 billion kWh (2009 est.) country comparison to the world: 72
95 million kWh (2009 est.) country comparison to the world: 197
Communication s
Telephones –
Main Lines in
Use
Internet Users
Transportation
231 million (2008) country comparison to the world: 2
Railways total: 226,427 km country comparison to the world: 1
Roadways
(Paved and
Unpaved
Highways
150 million (2008) country comparison to the world: 2
1.18 million (2011) country comparison to the world: 71
8 (2012) country comparison to the world: 227 total: 5,242 km country comparison to the world: 33 standard gauge: 5,242 km
1.435-m gauge (3,500 km electrified) (2009)
31,200 (2011) country comparison to the world: 175
Telephones - mobile cellular:
168,100 (2009) country comparison to the world: 145
NA
19,600 (2011) country comparison to the world: 191
23,000 (2009) country comparison to the world: 190 total: 9 km country comparison to the world: 134 standard gauge: 9 km
1.435-m gauge
(electrified) note: belongs to the
Austrian Railway System connecting Austria and
Switzerland (2008) total: 380 km country comparison to the world: 201 paved: 380 km (2010)
Airports with
Paved Runways total: 6,465,799 km country comparison to the world: 1 paved: 4,209,835 km (includes
75,040 km of expressways) unpaved:
2,255,964 km
(2007) total: 5,174 total: 25,554 km country comparison to the world: 101 paved: 724 km unpaved: 24,830 km (2006) total: 40,000 km country comparison to the world: 88 note: consists of 25,000 km of national and regional roads and
15,000 km of local roads; 206 km of urban roads are paved
(2011) total: 39 over 3,047 m: 3
2,438 to 3,047 m: 22
1,524 to 2,437 m: 8
914 to 1,523 m: 2 under 914 m: 4 (2013) total: 50 over 3,047 m: 1
2,438 to 3,047 m: 2
1,524 to 2,437 m: 14
914 to 1,523 m: 22 under 914 m:
11 (2013)
NA
Reflection:
1. How can the presence or absence of natural resources and ar able land affect a nation’s economy, regardless of the type of economic system?
If a country has few natural resources and little land available for crops, it may not be able to produce enough food and products for the people.
2. How can life expectancy and literacy rates affect the quality of labor in the economy?
A shorter life expectancy may indicate poor medical care, and lower literacy rates may indicate poor education, both of which can have negative impacts on production.
Name Date
3. How can fertility rates affect the use of scarce resources?
High fertility rates, especially in countries with few natural resources and lower GDPs, may indicate serious strains on scarce resources.
4. How can GDP per capita and poverty rates indicate standards of living in each system?
They can indicate standards of living in each system because GDP per capita is generally lower, and poverty rates are generally higher, in countries with lower standards of living.
5. How can the size of the industrial/service sector and the agriculture employment rate indicate the level of industrialization?
A larger industrial and service sector, and a larger number of people working outside of agriculture, can indicate a higher level of industrialization in the economy.
6. How can electricity, communication, and transportation facilities indicate the potential for industrial growth?
Greater electrical generation capacity, greater use of telephones and the Internet, and a greater availability of transportation via rail, highway, and airline can indicate a greater potential for increased industrialization.
7. Considering the lack of natural resources, the labor problems, and the lack of capital and little industrialization of developing countries, how can developing countries develop? (Hint: Look at
Economy - Overview for Chad).
Developing countries can develop by infusion of funds and capital from other nations, the World Bank, the
International Monetary Fund, and regional and humanitarian organizations.
8. Now that you have studied the economic characteristics of these three countries, define the terms market-oriented, command, and developing economy in your own words. For each term, describe the specific characteristics of the countries you studied that would help to support your definition.
