Comparative Systems Worksheet
advertisement
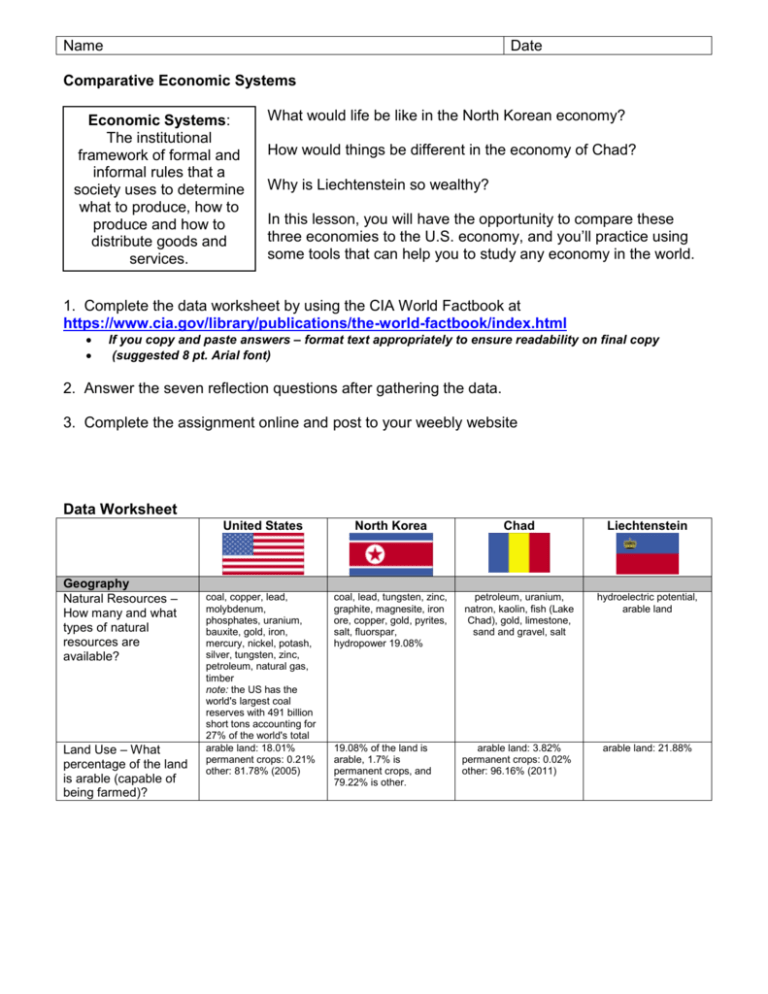
Name Date Comparative Economic Systems Economic Systems: The institutional framework of formal and informal rules that a society uses to determine what to produce, how to produce and how to distribute goods and services. What would life be like in the North Korean economy? How would things be different in the economy of Chad? Why is Liechtenstein so wealthy? In this lesson, you will have the opportunity to compare these three economies to the U.S. economy, and you’ll practice using some tools that can help you to study any economy in the world. 1. Complete the data worksheet by using the CIA World Factbook at https://www.cia.gov/library/publications/the-world-factbook/index.html If you copy and paste answers – format text appropriately to ensure readability on final copy (suggested 8 pt. Arial font) 2. Answer the seven reflection questions after gathering the data. 3. Complete the assignment online and post to your weebly website Data Worksheet Geography Natural Resources – How many and what types of natural resources are available? Land Use – What percentage of the land is arable (capable of being farmed)? United States North Korea Chad Liechtenstein coal, copper, lead, molybdenum, phosphates, uranium, bauxite, gold, iron, mercury, nickel, potash, silver, tungsten, zinc, petroleum, natural gas, timber note: the US has the world's largest coal reserves with 491 billion short tons accounting for 27% of the world's total arable land: 18.01% permanent crops: 0.21% other: 81.78% (2005) coal, lead, tungsten, zinc, graphite, magnesite, iron ore, copper, gold, pyrites, salt, fluorspar, hydropower 19.08% petroleum, uranium, natron, kaolin, fish (Lake Chad), gold, limestone, sand and gravel, salt hydroelectric potential, arable land 19.08% of the land is arable, 1.7% is permanent crops, and 79.22% is other. arable land: 3.82% permanent crops: 0.02% other: 96.16% (2011) arable land: 21.88% Name People Life Expectancy at Birth – How long are children born today expected to live? Date total population: 78.11 years country comparison to the world: 49 male: 75.65 years female: 80.69 years (2009 est.) total population: 69.51 years country comparison to the world: 155 male: 65.65 years female: 73.55 years total population: 49.07 years country comparison to the world: 223 male: 47.95 years female: 50.22 years (2013 est.) 1.99 children born/woman country comparison to the world: 131 4.8 children born/woman (2013 est.) country comparison to the world: 24 definition: age 15 and over can read and write French or Arabic total population: 35.4% male: 45.6% female: 25.4% (2011 est definition: age 10 and over can read and write total population: 100% male: 100% female: 100% Republic hereditary constitutional monarchy $21 billion (2012 est.) country comparison to the world: 129 $19.99 billion (2011 est.) $3.2 billion (2009) country comparison to the world: 179 $3.216 billion (2008) $19.89 billion (2010 est.) $3.159 billion (2007) Total Fertility Rate – How many children does each woman have, on average? 2.05 children born/woman (2009 est.) country comparison to the world: 126 Literacy Rate – What % of people over the age of 15 can read and write? definition: age 15 and over can read and write total population: 99% male: 99% female: 99% (2003 est.) definition: age 15 and over can read and write total population: 100% male: 100% female: 100% Constitution-based federal republic; strong democratic tradition Communist state oneman dictatorship GDP (PPP): $14.26 trillion (2009 est.) Budget: revenues: $1.914 trillion expenditures: $3.615 trillion (2009 est.) $40 billion (2011 est.) country comparison to the world: 104 $40 billion (2010 est.) $40 billion (2009 est.) note: data are in 2011 US dollars; North Korea does not publish reliable National Income Accounts data; the data shown here are derived from purchasing power parity (PPP) GDP estimates for North Korea that were made by Angus MADDISON in a study conducted for the OECD; his figure for 1999 was extrapolated to 2011 using estimated real growth rates for North Korea's GDP and an inflation factor based on the US GDP deflator; the results were rounded to the nearest $10 billion. Government Government Type – How are leaders elected? Government Spending as Percent of GDP (Budget Expenditures Divided by GDP). Find in Economy section $3.615 trillion / $14.26 trillion = .25 (25%) Military Spending as a Percentage of GDP. Find in Military section Economy Economy Overview – What are the most serious economic problems facing each of these four nations? Summarize from Economic Overview GDP Per Capita – What is the value of 4.06% of GDP (2005 est.) country comparison to the world: 28 Long-term problems include inadequate investment in economic infrastructure, rapidly rising medical and pension costs of an aging population, sizable trade and budget deficits, and stagnation of family income in the lower economic groups. $46,400 (2009 est.) country comparison to the world: 11 N/A $1,800 (2011 est.) country comparison to the world: 197 total population: 81.59 years country comparison to the world: 12 male: 79.45 years female: 84.29 years (2013 est.) 1.69 children born/woman (2013 est.) country comparison to the world: 171 note: data are in 2012 US dollars 1.6% of GDP (2011) N/A $2,000 (2012 est.) country comparison to the world: 194 $89,400 (2009 est.) country comparison to the world: 2 Name Date $1,800 (2010 est.) $1,900 (2009 est.) note: data are in 2011 US dollars N/A% $1,900 (2011 est.) $1,900 (2010 est.) note: data are in 2012 US dollars 80% (2001 est.) $90,600 (2008 est.) agriculture: 1.2% industry: 21.9% services: 76.9% (2009 est.) industry: 42.9% industry and services: 20% (2006 est.) industry: 39.4% farming, forestry, and fishing: 0.7% agriculture: 35% agriculture: 80% (2006 est.) agriculture: 0.8% oil, cotton textiles, meatpacking, brewing, natron (sodium carbonate), soap, cigarettes, construction materials electronics, metal manufacturing, dental products, ceramics, pharmaceuticals, food products, precision instruments, tourism, optical instruments goods and services produced per person? Population Below Poverty Line – How many people live in poverty? GDP Composition by Sector – What % of GDP is industry and services? Labor Force by Occupation – What % of workers is in agriculture? Industries – What are the primary industries? Are the industries primarily producing for consumer or government consumption? Determine this by assessing the industries and their consumers – answer not found at CIA WorldFactBook Agriculture Products – What are the primary agricultural goods produced? Industrial Production Growth Rate Electricity Production Communications Telephones – Main Lines in Use Internet Users Transportation Railways 12% (2004 est.) leading industrial power in the world, highly diversified and technologically advanced; petroleum, steel, motor vehicles, aerospace, telecommunications, chemicals, electronics, food processing, consumer goods, lumber, mining military products; machine building, electric power, chemicals; mining (coal, iron ore, limestone, magnesite, graphite, copper, zinc, lead, and precious metals), metallurgy; textiles, food processing; tourism $89,700 (2007 est.) N/A% Mostly producing for the consumer (private citizens) wheat, corn, other grains, fruits, vegetables, cotton; beef, pork, poultry, dairy products; fish; forest products -5.5% (2009 est.) country comparison to the world: 110 4.11 trillion kWh (2008 est.) country comparison to the world: 1 rice, corn, potatoes, soybeans, pulses; cattle, pigs, pork, eggs cotton, sorghum, millet, peanuts, rice, potatoes, manioc (tapioca); cattle, sheep, goats, camels wheat, barley, corn, potatoes; livestock, dairy products industry: 9.2% N/A% 20.45 billion kWh (2009 est.) country comparison to the world: 72 95 million kWh (2009 est.) country comparison to the world: 197 N/A 150 million (2008) country comparison to the world: 2 231 million (2008) country comparison to the world: 2 1.18 million (2011) country comparison to the world: 71 31,200 (2011) country comparison to the world: 175 168,100 (2009) country comparison to the world: 145 19,600 (2011) country comparison to the world: 191 23,000 (2009) country comparison to the world: 190 total: 226,427 km country comparison to the world: 1 total: 5,242 km country comparison to the world: 33 N/A N/A total: 9 km country comparison to the world: 134 standard gauge: 9 km 1.435-m gauge (electrified) Name Date Roadways (Paved and Unpaved Highways total: 6,465,799 km country comparison to the world: 1 paved: 4,209,835 km (includes 75,040 km of expressways) unpaved: 2,255,964 km (2007) total: 25,554 km country comparison to the world: 101 paved: 724 km unpaved: 24,830 km (2006) Airports with Paved Runways total: 5,174 total: 39 over 3,047 m: 3 2,438 to 3,047 m: 22 1,524 to 2,437 m: 8 914 to 1,523 m: 2 under 914 m: 4 (2013) total: 40,000 km country comparison to the world: 88 note: consists of 25,000 km of national and regional roads and 15,000 km of local roads; 206 km of urban roads are paved (2011) total: 9 over 3,047 m: 2 2,438 to 3,047 m: 4 1,524 to 2,437 m: 2 under 914 m: 1 (2013) note: belongs to the Austrian Railway System connecting Austria and Switzerland (2008) paved: 380 km (2010) N/A Reflection: 1. How can the presence or absence of natural resources and arable land affect a nation’s economy, regardless of the type of economic system? Presence or abuse of natural resources and arable land affect’s a nation’s economy because it doesn’t allow then to farm as much or produce as much product as you would be able to if you don’t abuse the land. 2. How can life expectancy and literacy rates affect the quality of labor in the economy? Life expectancy and literacy rates affect the quality of labor in the economy because the smarter the people, the more will get done and it will get done more efficiently. 3. How can fertility rates affect the use of scarce resources? Fertility rates affect the use of scarce resources because the more fertility rate, the scarce resources become even more scarce. 4. How can GDP per capita and poverty rates indicate standards of living in each system? GDP per capita and poverty rates indicate standards of living in each system by 5. How can the size of the industrial/service sector and the agriculture employment rate indicate the level of industrialization? The size of the industrial/service sector and the agriculture employment rate indicate the level of Industrialization by Name Date 6. How can electricity, communication, and transportation facilities indicate the potential for industrial growth? electricity, communication, and transportation facilities indicate the potential for industrial growth because if You don’t have communications, you cannot contact other business to buy your product. 7. Considering the lack of natural resources, the labor problems, and the lack of capital and little industrialization of developing countries, how can developing countries develop? (Hint: Look at Economy - Overview for Chad). 8. Now that you have studied the economic characteristics of these three countries, define the terms market-oriented, command, and developing economy in your own words. For each term, describe the specific characteristics of the countries you studied that would help to support your definition. Market-orientated: Free economy, no government saying what to do or how to do it Command: Government is in charge of what happens legally and how things are to be done Developing economy:
