Physics 1 Lab: Plane Old Motion
advertisement
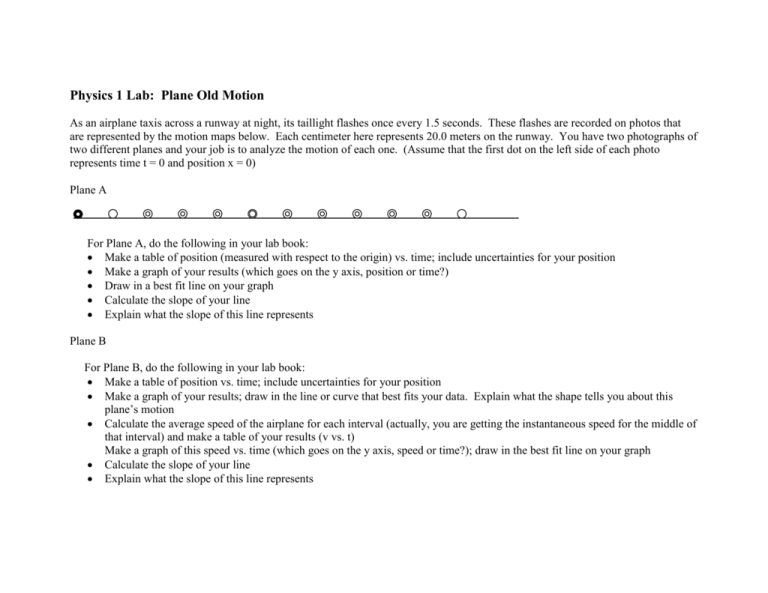
Physics 1 Lab: Plane Old Motion As an airplane taxis across a runway at night, its taillight flashes once every 1.5 seconds. These flashes are recorded on photos that are represented by the motion maps below. Each centimeter here represents 20.0 meters on the runway. You have two photographs of two different planes and your job is to analyze the motion of each one. (Assume that the first dot on the left side of each photo represents time t = 0 and position x = 0) Plane A For Plane A, do the following in your lab book: Make a table of position (measured with respect to the origin) vs. time; include uncertainties for your position Make a graph of your results (which goes on the y axis, position or time?) Draw in a best fit line on your graph Calculate the slope of your line Explain what the slope of this line represents Plane B For Plane B, do the following in your lab book: Make a table of position vs. time; include uncertainties for your position Make a graph of your results; draw in the line or curve that best fits your data. Explain what the shape tells you about this plane’s motion Calculate the average speed of the airplane for each interval (actually, you are getting the instantaneous speed for the middle of that interval) and make a table of your results (v vs. t) Make a graph of this speed vs. time (which goes on the y axis, speed or time?); draw in the best fit line on your graph Calculate the slope of your line Explain what the slope of this line represents
