Economics Chapter 1 review with answers
advertisement
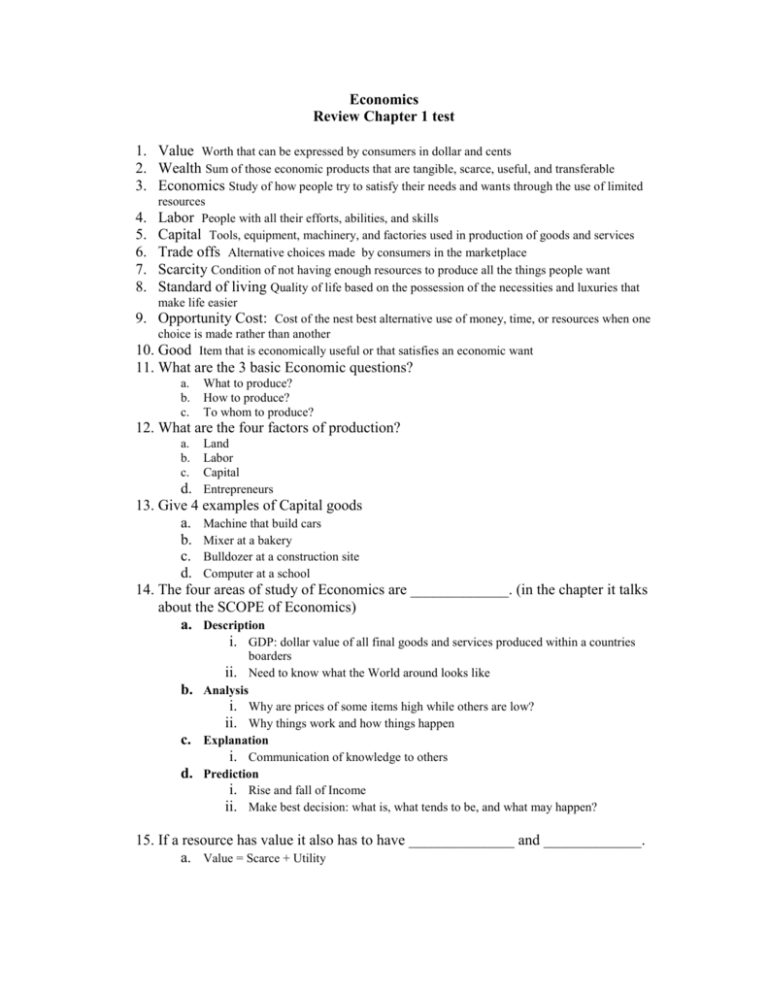
Economics Review Chapter 1 test 1. Value Worth that can be expressed by consumers in dollar and cents 2. Wealth Sum of those economic products that are tangible, scarce, useful, and transferable 3. Economics Study of how people try to satisfy their needs and wants through the use of limited 4. 5. 6. 7. 8. 9. resources Labor People with all their efforts, abilities, and skills Capital Tools, equipment, machinery, and factories used in production of goods and services Trade offs Alternative choices made by consumers in the marketplace Scarcity Condition of not having enough resources to produce all the things people want Standard of living Quality of life based on the possession of the necessities and luxuries that make life easier Opportunity Cost: Cost of the nest best alternative use of money, time, or resources when one choice is made rather than another Good Item that is economically useful or that satisfies an economic want 10. 11. What are the 3 basic Economic questions? a. b. c. What to produce? How to produce? To whom to produce? 12. What are the four factors of production? a. b. c. Land Labor Capital Entrepreneurs d. 13. Give 4 examples of Capital goods a. Machine that build cars b. Mixer at a bakery c. Bulldozer at a construction site d. Computer at a school 14. The four areas of study of Economics are _____________. (in the chapter it talks about the SCOPE of Economics) a. Description i. GDP: dollar value of all final goods and services produced within a countries boarders ii. Need to know what the World around looks like b. Analysis i. Why are prices of some items high while others are low? ii. Why things work and how things happen c. Explanation i. Communication of knowledge to others d. Prediction i. Rise and fall of Income ii. Make best decision: what is, what tends to be, and what may happen? 15. If a resource has value it also has to have ______________ and _____________. a. Value = Scarce + Utility 16. What is the paradox of value? Explain using the example of water and diamonds. a. Contradiction between necessities and value The situation in which some necessities have little value while some non-necessities have a much higher value b. Water is a need but cost less than diamonds that are a wont 17. What is a service? List three examples a. b. Work that is preformed by someone for someone Banks, grocery stores, hair cut 18. What are goods? List three examples a. Item that is economically useful or satisfies an economic want b. 19. Car, T.V., Blow Dryer Specialization a. a. FOP can perform tasks that they can do more efficiently than others Performing one task relatively more efficiently than another 20. Economic Interdependence a. We rely and others and others rely on us to provide goods and services that we consume i. Cars are built in the US but parts may be made in another country 21. Division of Labor a. Assembly line production 22. What are decision making grids and what are they used for in Economics? a. Trade-offs are the alternative choices people face in making an economic decision. A b. decision-making grid lists the advantages and disadvantages of each choice. Alternative choices of action 23. What is opportunity cost? Explain using Homework and Time with friends a. Opportunity cost is the cost of the next best alternative among a person’s choices. The b. opportunity cost is the money, time, or resources a person gives up, or sacrifices, to make his final choice. By staying home to study for an economics test the opportunity cost is the time spent with friends. However, the benefits of studying for the test out way the cost. 24. What is the relationship between Trade-offs and opportunity cost? a. Opportunity cost are incurred when trade-offs are made 25. What are the characteristics of the Production possibility Frontier? a. It shows the combinations of goods and/or services that can be produced when all b. 26. What does the Study of Economics help people with? a. 27. productive resources are used. The line on the graph represents the full potential—the frontier—when the economy employs all of these productive resources. it illustrates the concept of opportunity cost; it is used by economists as a tool for description and analysis; it indicates the ideal production levels for goods and services Become better decision makers Economic Decision Making a. b. c. Building simple models Using cost-benefit analysis Taking small, incremental steps 28. Review the Circular flow of economics and be able to explain how it “works.” Individuals provide Labor (a factor of production) to the factor market; business look to the factor market to hire labor; once hired individuals work to provide services or produce goods for the product market; the product market provides goods and services to the individuals to purchase. Businesses pay for the factors of product(resource) i.e. paying labor for their services; individuals then spending their income in the product market to purchase goods and services; Money paid for goods and services and “returned” to the businesses for goods and services provided 29. Using the figures on Page 23 in your book (PPF) discuss the following a. When you are producing goods on the red line (letter A, B, or C)…what does that mean? b. Using graph A: What could cause production to move form point b to e? c. Using graph A: can Production move from point a to d? why or why not Companies producing on the red line are producing at max. production using all the resources provided Companies producing at letter e are not using resources efficiently. The opportunity cost is what they could be producing The only way for companies to produce at letter d their must be economic growth.
