Human Population Growth: Worksheet & Data Analysis
advertisement
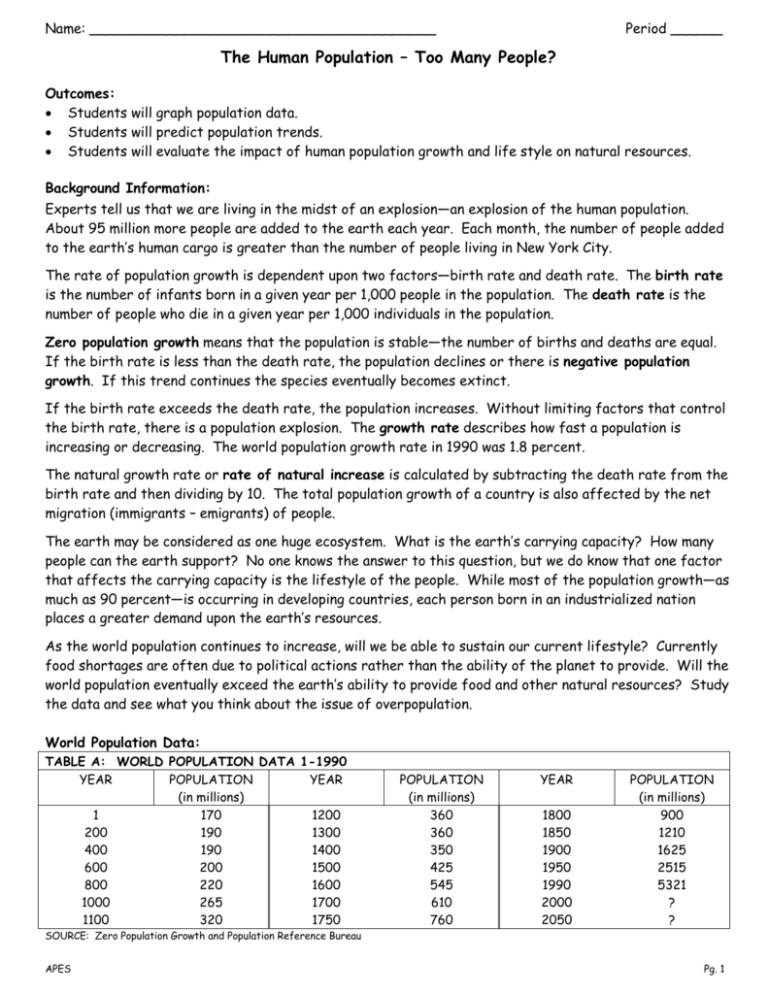
Name: ________________________________________ Period ______ The Human Population – Too Many People? Outcomes: Students will graph population data. Students will predict population trends. Students will evaluate the impact of human population growth and life style on natural resources. Background Information: Experts tell us that we are living in the midst of an explosion—an explosion of the human population. About 95 million more people are added to the earth each year. Each month, the number of people added to the earth’s human cargo is greater than the number of people living in New York City. The rate of population growth is dependent upon two factors—birth rate and death rate. The birth rate is the number of infants born in a given year per 1,000 people in the population. The death rate is the number of people who die in a given year per 1,000 individuals in the population. Zero population growth means that the population is stable—the number of births and deaths are equal. If the birth rate is less than the death rate, the population declines or there is negative population growth. If this trend continues the species eventually becomes extinct. If the birth rate exceeds the death rate, the population increases. Without limiting factors that control the birth rate, there is a population explosion. The growth rate describes how fast a population is increasing or decreasing. The world population growth rate in 1990 was 1.8 percent. The natural growth rate or rate of natural increase is calculated by subtracting the death rate from the birth rate and then dividing by 10. The total population growth of a country is also affected by the net migration (immigrants – emigrants) of people. The earth may be considered as one huge ecosystem. What is the earth’s carrying capacity? How many people can the earth support? No one knows the answer to this question, but we do know that one factor that affects the carrying capacity is the lifestyle of the people. While most of the population growth—as much as 90 percent—is occurring in developing countries, each person born in an industrialized nation places a greater demand upon the earth’s resources. As the world population continues to increase, will we be able to sustain our current lifestyle? Currently food shortages are often due to political actions rather than the ability of the planet to provide. Will the world population eventually exceed the earth’s ability to provide food and other natural resources? Study the data and see what you think about the issue of overpopulation. World Population Data: TABLE A: WORLD POPULATION DATA 1-1990 YEAR POPULATION YEAR (in millions) 1 170 1200 200 190 1300 400 190 1400 600 200 1500 800 220 1600 1000 265 1700 1100 320 1750 POPULATION (in millions) 360 360 350 425 545 610 760 YEAR 1800 1850 1900 1950 1990 2000 2050 POPULATION (in millions) 900 1210 1625 2515 5321 ? ? SOURCE: Zero Population Growth and Population Reference Bureau APES Pg. 1 TABLE B: WORLD POPULATION DATA 1950-1992 YEAR POPULATION YEAR (billion) 1950 2.6 1965 1951 2.6 1966 1952 2.6 1967 1953 2.7 1968 1954 2.7 1069 1955 2.8 1070 1956 2.8 1971 1957 2.9 1972 1958 2.9 1973 1959 3.0 1974 1960 3.0 1975 1961 3.1 1976 1962 3.1 1977 1963 3.2 1978 1964 3.3 1979 POPULATION (billion) 3.3 3.4 3.5 3.6 3.6 3.7 3.8 3.9 3.9 4.0 4.1 4.2 4.2 4.3 4.4 YEAR 1980 1981 1982 1983 1984 1985 1986 1987 1988 1989 1990 1991 1992 POPULATION (billion) 4.5 4.5 4.6 4.7 4.7 4.8 4.9 5.0 5.1 5.2 5.3 5.3 5.5 SOURCE: World Watch Institute Vital Signs 1993… Graphing Procedure: 1. Using data in Table A, plot the world population data from the year 1500 to the year 1990. Place the independent variable (time) on the horizontal or X axis and the dependent variable (population) on the vertical or Y axis. 2. Determine a scale that will allow use of the full page (at least three-fourths) of the graph paper. Label the graph “World Population Growth 1500 – 1990.” 3. Draw a best line to fit the plotted points. This graph shows the growth in population since the discovery of America. 4. Following the procedure outlined above, create a separate graph using the data in Table B. Use 5 year time intervals. Label the graph “World Population Growth 1950 – 1992.” This graph shows the population growth during the life of a middle-aged person—perhaps your parents or your teacher. Analysis: 1. Refer to Table A. At what time in history does the data indicate a negative population growth? ______________________ 2. What causes a negative population growth? ___________________________________________ Which do you think played a greater role in the population decline—a change in birth rate or a change in death rate? _________________________________________________________________ What might have caused this change? _______________________________________________ ____________________________________________________________________________ 3. Why do the two graphs appear to have a different shape? ________________________________ ____________________________________________________________________________ 4. When did the world’s population begin to increase rapidly? ________________________________ ____________________________________________________________________________ APES Pg. 2 5. The graph “World Population 1950 – 1992” shows the growth in population over a 42-year period. Estimate the population when you are 42 years old. _____________________________________ 6. In the following chart: Estimate the year that the world population reached one billion, two billion, and 4 billion people. Calculate the time it took for the population to double. Predict the year that the world population will reach 8 billion and calculate the doubling time based on your prediction. Estimated Doubling Time for World Population World Population Year Doubling Time 1 billion 2 billion 4 billion 8 billion How has the doubling rate changed? ___________________________________________________ 7. Calculate the growth rate (natural rate of increase) of the population for each of the following countries. (See Background Information for method.) Country Population Growth in Selected Countries Natural Increase Rate Births Deaths Kenya 46 7 Denmark 12 12 United States 16 9 India 32 11 China 21 7 Mexico 30 6 Canada 14 7 Doubling Time 8. The doubling time is calculated by dividing 70 by the growth rate of the population. Calculate the doubling time for each of the countries in the chart in question 7. A. Is there greater variation in the birth rates or the death rates of the selected countries? __________________________________________________________________________ B. Has any country reached zero population growth? _______ If so, which one? _______________ C. Compare the growth rates of the United States and Canada. ____________________________ __________________________________________________________________________ D. Compare the growth rates of China and India. _______________________________________ __________________________________________________________________________ APES Pg. 3 9. How many people are added to the earth each year? _____________________ What is the doubling time for the world population? (See Background Information.) _____________________________ 10. At the current growth rate, how many days did it take for the world population to recover from each of the following disasters? A. The approximately 200,000 people killed by a cyclone in Bangladesh (1991) _________________ B. The three million deaths caused by a famine in India (1969-70) __________________________ C. The 260,000 people lost in automobile accidents (as of 1989) ___________________________ D. The 21,000,000 deaths caused by an influenza epidemic in 1918 __________________________ 11. How has technology affected the growth of the human population? Cite specific examples. ____________________________________________________________________________ ____________________________________________________________________________ ____________________________________________________________________________ ____________________________________________________________________________ 12. Many scientists agree that without limits to population growth we will destroy the planet. But some people think that the human population differs from other populations because humans can use technology. Examine the data in the chart below and answer the following questions. Year 1950 1955 1960 1965 1970 1975 1980 1985 1990 Grain Production (kg per person) 247 273 279 274 296 306 325 343 336 Food Production 1950-1990 Soybean Production Year (kg per person) 1950 7 1955 8 1960 9 1965 11 1970 12 1975 16 1980 18 1985 20 1990 20 Year 1950 1955 1960 1965 1970 1975 1980 1985 1990 Fish Catch (kg per person) 8.6 10.4 12.5 16.1 17.8 16.2 16.2 17.7 18.3 Does the concept of carrying capacity apply to the human population? _______________________ Can the earth’s carrying capacity be determined from the graphs and charts? __________________ Do you think the human population is reaching the earth’s carrying capacity? Explain your answer. _______________________________________________________________________________ _______________________________________________________________________________ _______________________________________________________________________________ APES Pg. 4 Making the Connections: Describe the relationships between the growth of the human population and the following environmental factors. Forests: _______________________________________________________________________ _______________________________________________________________________________ Flooding: _______________________________________________________________________ _______________________________________________________________________________ Prime Farmland: _________________________________________________________________ _______________________________________________________________________________ Toxic Chemicals: _________________________________________________________________ _______________________________________________________________________________ Biodiversity: ____________________________________________________________________ _______________________________________________________________________________ Climate: _______________________________________________________________________ _______________________________________________________________________________ Water: ________________________________________________________________________ _______________________________________________________________________________ Minerals: ______________________________________________________________________ _______________________________________________________________________________ Productivity of the Ocean: _________________________________________________________ _______________________________________________________________________________ Air Quality: ____________________________________________________________________ _______________________________________________________________________________ Urban Stress: ___________________________________________________________________ _______________________________________________________________________________ Energy: ________________________________________________________________________ _______________________________________________________________________________ Extension: California’s Central Valley lost 140,000 acres of farmland between 1974 and 1986. Based on current development demands, the valley will lose an additional 300,000 acres by 2010. Your job is to create a plan for development that will provide the housing needs of the expanding population and at the same time maintain open space and reduce the pressure on the development of farmland. Your plan should also address other environmental problems such as water use and air quality. APES Pg. 5 APES Pg. 6 APES Pg. 7 Key (1 point each; graphs are 25 pts each) 1. Refer to Table A. At what time in history does the data indicate a negative population growth? 1300 - 1400 2. What causes a negative population growth? more deaths than births Which do you think played a greater role in the population decline—a change in birth rate or a change in death rate? change in birth rate What might have caused this change? demographic transition 3. Why do the two graphs appear to have a different shape? different time scales 4. When did the world’s population begin to increase rapidly? ≈ 1850 5. The graph “World Population 1950 – 1992” shows the growth in population over a 42-year period. Estimate the population when you are 42 years old. any answer 6. In the following chart: Estimate the year that the world population reached one billion, two billion, and 4 billion people. Calculate the time it took for the population to double. Predict the year that the world population will reach 8 billion and calculate the doubling time based on your prediction. Estimated Doubling Time for World Population World Population Year Doubling Time 1 billion 1825 2 billion 1930 105 yrs 4 billion 1974 44 yrs 8 billion 2050 76 yrs All approximations How has the doubling rate changed? faster, then slowed down 7. Calculate the growth rate (natural rate of increase) of the population for each of the following countries. (See Background Information for method.) Country Population Growth in Selected Countries Natural Increase Rate Births Deaths Doubling Time Kenya 46 7 3.9 17.9 yrs Denmark 12 12 0 0 yrs United States 16 9 .7 100 yrs India 32 11 2.1 33 yrs China 21 7 1.4 50 yrs Mexico 30 6 2.4 29 yrs Canada 14 7 .7 100 yrs APES - Casterlin 70 N. I. 8. The doubling time is calculated by dividing 70 by the growth rate of the population. Calculate the doubling time for each of the countries in the chart in question 7. A. Is there greater variation in the birth rates or the death rates of the selected countries? birth rates B. Has any country reached zero population growth? yes If so, which one? Denmark C. Compare the growth rates of the United States and Canada. They are the same. D. Compare the growth rates of China and India. India is growing faster than China 9. How many people are added to the earth each year? 95 million What is the doubling time for the world population? (See Background Information.) 38.9 years 70 1.8 10. At the current growth rate, how many days did it take for the world population to recover from each of the following disasters? 95 million people = 260,274 people added to earth each day 365 days A. The approximately 200,000 people killed by a cyclone in Bangladesh (1991) less than a day 200,000 people = .77 day 260,274 people/day Since we add 260,000 people to the earth each day, the actual number of people that were killed was replaced in less than a day. I tell the kids that, no, we don't actually replace people...because those people had families and people that loved them. But, when we look at data and numbers, we see that all those people that died that day don’t even make a dip in the graph. The only time the human pop has dipped was during the Black plague (in the 1300s). B. The three million deaths caused by a famine in India (1969-70) eleven & ½ days 3,000,000 people = 11.5 days 260,274 people/day C. The 260,000 people lost in automobile accidents (as of 1989) one day D. The 21,000,000 deaths caused by an influenza epidemic in 1918 almost 81 days 21,000,000 people = 80.7 days 260,274 people/day 11. any answer 12. Does the concept of carrying capacity apply to the human population? yes Can the earth’s carrying capacity be determined from the graphs and charts? no Do you think the human population is reaching the earth’s carrying capacity? Explain your answer. any answer APES - Casterlin The Human Population – Too Many People? (lab book version) Outcomes: Students will graph population data. Students will predict population trends. Students will evaluate the impact of human population growth and life style on natural resources. Background Information: Experts tell us that we are living in the midst of an explosion—an explosion of the human population. About 95 million more people are added to the earth each year. Each month, the number of people added to the earth’s human cargo is greater than the number of people living in New York City. The rate of population growth is dependent upon two factors—birth rate and death rate. The birth rate is the number of infants born in a given year per 1,000 people in the population. The death rate is the number of people who die in a given year per 1,000 individuals in the population. Zero population growth means that the population is stable—the number of births and deaths are equal. If the birth rate is less than the death rate, the population declines or there is negative population growth. If this trend continues the species eventually becomes extinct. If the birth rate exceeds the death rate, the population increases. Without limiting factors that control the birth rate, there is a population explosion. The growth rate describes how fast a population is increasing or decreasing. The world population growth rate in 1990 was 1.8 percent. The natural growth rate or rate of natural increase is calculated by subtracting the death rate from the birth rate and then dividing by 10. The total population growth of a country is also affected by the net migration (immigrants – emigrants) of people. The earth may be considered as one huge ecosystem. What is the earth’s carrying capacity? How many people can the earth support? No one knows the answer to this question, but we do know that one factor that affects the carrying capacity is the lifestyle of the people. While most of the population growth—as much as 90 percent—is occurring in developing countries, each person born in an industrialized nation places a greater demand upon the earth’s resources. APES - Casterlin Pg. 1 The Human Population – Too Many People? (lab book version) As the world population continues to increase, will we be able to sustain our current lifestyle? Currently food shortages are often due to political actions rather than the ability of the planet to provide. Will the world population eventually exceed the earth’s ability to provide food and other natural resources? Study the data and see what you think about the issue of overpopulation. World Population Data: TABLE A: WORLD POPULATION DATA 1-1990 YEAR POPULATION YEAR POPULATION (in millions) (in millions) 1 170 1200 360 200 190 1300 360 400 190 1400 350 600 200 1500 425 800 220 1600 545 1000 265 1700 610 1100 320 1750 760 YEAR 1800 1850 1900 1950 1990 2000 2050 POPULATION (in millions) 900 1210 1625 2515 5321 ? ? SOURCE: Zero Population Growth and Population Reference Bureau TABLE B: WORLD POPULATION DATA 1950-1992 YEAR POPULATION YEAR POPULATION (billion) (billion) 1950 2.6 1965 3.3 1951 2.6 1966 3.4 1952 2.6 1967 3.5 1953 2.7 1968 3.6 1954 2.7 1069 3.6 1955 2.8 1070 3.7 1956 2.8 1971 3.8 1957 2.9 1972 3.9 1958 2.9 1973 3.9 1959 3.0 1974 4.0 1960 3.0 1975 4.1 1961 3.1 1976 4.2 1962 3.1 1977 4.2 1963 3.2 1978 4.3 1964 3.3 1979 4.4 YEAR 1980 1981 1982 1983 1984 1985 1986 1987 1988 1989 1990 1991 1992 POPULATION (billion) 4.5 4.5 4.6 4.7 4.7 4.8 4.9 5.0 5.1 5.2 5.3 5.3 5.5 SOURCE: World Watch Institute Vital Signs 1993… APES - Casterlin Pg. 2 The Human Population – Too Many People? (lab book version) Graphing Procedure: 1. Using data in Table A, plot the world population data from the year 1500 to the year 1990. Place the independent variable (time) on the horizontal or X-axis and the dependent variable (population) on the vertical or Y-axis. 2. Determine a scale that will allow use of the full page (at least three-fourths) of the graph paper. Label the graph “World Population Growth 1500 – 1990.” 3. Draw a best line to fit the plotted points. This graph shows the growth in population since the discovery of America. 4. Following the procedure outlined above, create a separate graph using the data in Table B. Use 5-year time intervals. Label the graph “World Population Growth 1950 – 1992.” This graph shows the population growth during the life of a middleaged person—perhaps your parents or your teacher. APES - Casterlin Pg. 3 The Human Population – Too Many People? (lab book version) APES - Casterlin Pg. 4 The Human Population – Too Many People? (lab book version) APES - Casterlin Pg. 5 The Human Population – Too Many People? (lab book version) Analysis: 1. Refer to Table A. At what time in history does the data indicate a negative population growth? _________________________________ 2. What causes a negative population growth? ____________________________ Which do you think played a greater role in the population decline—a change in birth rate or a change in death rate? ________________________________ What might have caused this change? ________________________________ _____________________________________________________________ _____________________________________________________________ 3. Why do the two graphs appear to have a different shape? _____________________________________________________________ 4. When did the world’s population begin to increase rapidly? ________________ 5. The graph “World Population 1950 – 1992” shows the growth in population over a 42-year period. Estimate the population when you are 42 years old. ________________________________ 6. In the following chart: Estimate the year that the world population reached one billion, two billion, and 4 billion people. Calculate the time it took for the population to double. Predict the year that the world population will reach 8 billion and calculate the doubling time based on your prediction. Estimated Doubling Time for World Population World Population Year Doubling Time 1 billion 2 billion 4 billion 8 billion How has the doubling rate changed? ____________________________________ APES - Casterlin Pg. 6 The Human Population – Too Many People? (lab book version) 7. Calculate the growth rate (natural rate of increase) of the population for each of the following countries. (See Background Information for method.) Country Population Growth in Selected Countries Natural Increase Births Deaths Rate Kenya 46 7 Denmark 12 12 United States 16 9 India 32 11 China 21 7 Mexico 30 6 Canada 14 7 Doubling Time 8. The doubling time is calculated by dividing 70 by the growth rate of the population. Calculate the doubling time for each of the countries in the chart in question 7. A. Is there greater variation in the birth rates or the death rates of the selected countries? _______________________________________ B. Has any country reached zero population growth? _______ If so, which one? _____________________________________ C. Compare the growth rates of the United States and Canada. __________________________________________________________ D. Compare the growth rates of China and India. __________________________________________________________ __________________________________________________________ 9. How many people are added to the earth each year? _____________________ What is the doubling time for the world population? (See Background Information.) _____________________ APES - Casterlin Pg. 7 The Human Population – Too Many People? (lab book version) 10. At the current growth rate, how many days did it take for the world population to recover from each of the following disasters? (Show your work with units!) A. The approximately 200,000 people killed by a cyclone in Bangladesh (1991) B. The three million deaths caused by a famine in India (1969-70) C. The 260,000 people lost in automobile accidents (as of 1989) D. The 21,000,000 deaths caused by an influenza epidemic in 1918 11. How has technology affected the growth of the human population? Cite specific examples. _____________________________________________________________ _____________________________________________________________ _____________________________________________________________ _____________________________________________________________ APES - Casterlin Pg. 8 The Human Population – Too Many People? (lab book version) 12. Many scientists agree that without limits to population growth we will destroy the planet. But some people think that the human population differs from other populations because humans can use technology. Examine the data in the chart below and answer the following questions. Food Production 1950-1990 Year Grain Production (kg per person) Year Soybean Production (kg per person) Year 1950 1955 1960 1965 1970 1975 1980 1985 1990 247 273 279 274 296 306 325 343 336 1950 1955 1960 1965 1970 1975 1980 1985 1990 7 8 9 11 12 16 18 20 20 1950 1955 1960 1965 1970 1975 1980 1985 1990 Fish Catch (kg per person) 8.6 10.4 12.5 16.1 17.8 16.2 16.2 17.7 18.3 Does the concept of carrying capacity apply to the human population? ___________ Can the earth’s carrying capacity be determined from the graphs and charts? _______________________________________________________________ Do you think the human population is reaching the earth’s carrying capacity? Explain your answer. _______________________________________________________________ _______________________________________________________________ _______________________________________________________________ _______________________________________________________________ _______________________________________________________________ APES - Casterlin Pg. 9 The Human Population – Too Many People? (lab book version) Making the Connections: Describe the relationships between the growth of the human population and the following environmental factors. Forests: Flooding: Prime Farmland: Toxic Chemicals: Biodiversity: Climate: Water: Minerals: Productivity of the Ocean: Air Quality: Urban Stress: Energy: APES - Casterlin Pg. 10
