Lab 1500-5 - Otterbein
advertisement
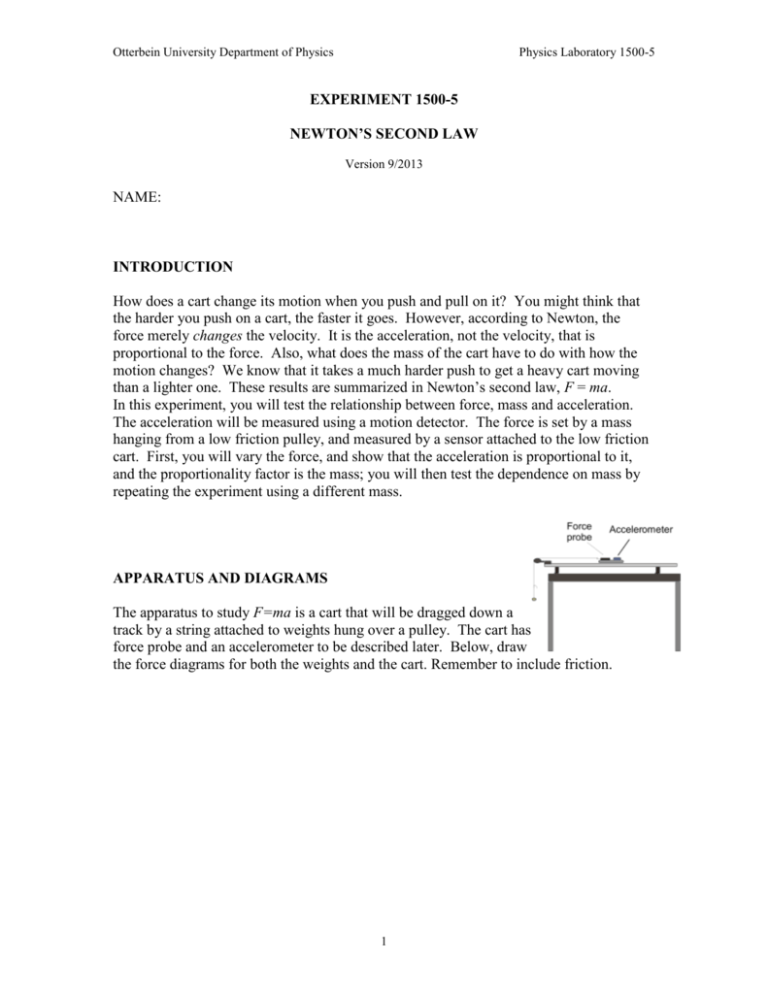
Otterbein University Department of Physics Physics Laboratory 1500-5 EXPERIMENT 1500-5 NEWTON’S SECOND LAW Version 9/2013 NAME: INTRODUCTION How does a cart change its motion when you push and pull on it? You might think that the harder you push on a cart, the faster it goes. However, according to Newton, the force merely changes the velocity. It is the acceleration, not the velocity, that is proportional to the force. Also, what does the mass of the cart have to do with how the motion changes? We know that it takes a much harder push to get a heavy cart moving than a lighter one. These results are summarized in Newton’s second law, F = ma. In this experiment, you will test the relationship between force, mass and acceleration. The acceleration will be measured using a motion detector. The force is set by a mass hanging from a low friction pulley, and measured by a sensor attached to the low friction cart. First, you will vary the force, and show that the acceleration is proportional to it, and the proportionality factor is the mass; you will then test the dependence on mass by repeating the experiment using a different mass. APPARATUS AND DIAGRAMS The apparatus to study F=ma is a cart that will be dragged down a track by a string attached to weights hung over a pulley. The cart has force probe and an accelerometer to be described later. Below, draw the force diagrams for both the weights and the cart. Remember to include friction. 1 Otterbein University Department of Physics Physics Laboratory 1500-5 DATA ACQUISITION 1. Bring the scale to your table and measure the masses of the cart and the black bars. Hold one end of the sensor cables when you measure the mass of the cart – this will approximate the situation of the cart when it is attached to the LabPro. Record your measurements. 2. The accelerometer uses an integrated circuit (computer chip) originally designed to control the release of air bags in an automobile. It contains very thin “fingers” micromachined out of silicon arranged like the plates of a capacitor (a device to hold electric charge, to be studied next quarter). When the fingers flex, the capacitance (ability of the fingers to hold electric charge) changes, which can be measured electronically. The device measures the component of acceleration in the direction of the arrow marked on the casing. Set it up by adding the “Low g accelerometer” from the pull-down menu. 3. Next, check the force sensor. With no tension in the string attached to it, zero the force sensor, using Zero from the Experiment menu. The force sensor should now read zero (the reading is visible in the bottom line of the screen). Now hang 0.3 kg mass from the string. The force is 0.3 kg 9.8 m/s2, or 2.94 N. Verify that the sensor is close to being correct. 4. Now that you have checked all the sensors are working properly, you are ready to start collecting data. Set the sample rate to 30/sec and the length of the experiment to 3 seconds. (You’ll have to do this only once.) Make sure someone is at the end of the track to catch the cart. Otherwise, the cart will bang into the pulley and damage the cart, pulley and anything else that could possibly break! Before each trial, click the Zero button, and with the cart at rest and no tension in the string, zero both sensors. Hang a mass of 0.05 kg from the string. Click the Collect button. When the data starts to collect, release the cart. 5. Select the portion of your graph where the cart was in a state of constant acceleration. Use the Statistics button to measure the average force and acceleration in this portion of the graph. Record the data in your table. Repeat the data collection for the remaining values of the hanging masses. 6. Repeat for different hanging weights, filling the data into the table for Run 1, below. 7. Add the weighted bar to the cart. Repeat steps 4-6 with the bar mass on top of the force probe. This means that you will have to have some dexterity to catch the mass and cart before they crash. Be careful! In the form, fill in the total mass of the cart + weight, and repeat your measurements, filling out the table for Run 2, below. 2 Otterbein University Department of Physics Physics Laboratory 1500-5 Run 1: Measured mass of cart (kg) Hanging mass (kg) FApplied (N) ΔFApplied (N) a (m/s2) Δa (m/s2) ΔFApplied (N) a (m/s2) Δa (m/s2) .05 .1 .15 .2 .25 .3 Run 2: Measured mass of cart + bar (kg) Hanging mass (kg) FApplied (N) .05 .1 .15 .2 .25 .3 3 Otterbein University Department of Physics Physics Laboratory 1500-5 GRAPHS AND ANALYSIS 1. In your force diagrams above, you should include friction. Show that the force measured by the sensor should be related to the acceleration of the cart by Fapplied ma F friction 2. The above result implies that a linear graph can be made between Fapplied and a, similar to y = mx + b. Get two pieces of graph paper per student, and carefully draw the graphs for Run 1 and 2, i.e. plot Fapplied (a) versus a. Include the uncertainties (“Δ values”) as error bars on your points (both vertical and horizontal error bars!). Use a pencil so you can fix mistakes. Carefully label everything and remember to specify units. 3. Draw the best-fit line through each set of data with the help of a ruler. Use the method we learned in the very first lab. Incidentally, the human eye is really good at this, so your results should be accurate. 4. What do the slopes of the best-fit line correspond to? _______________ What do the y-intercepts of the line correspond to? _________________ 5. Find the slopes and intercepts of each run on your graph papers. Find the uncertainty of the slopes by drawing in a line that has a slope different from the best-fit line but that still touches the edge of most of the error bars. Find the slope 4 Otterbein University Department of Physics Physics Laboratory 1500-5 and intercepts of these lines and label them as the uncertainty on the slope and intercept from your best-fit measurement. 6. Use the above data to complete the blanks below: Run 1: Direct measurement: Mass of cart =______ From graph: Mass of cart: _________ +/- ________ Force of friction: _________ +/- ________ Run 2: Direct measurement: Mass of cart =______ From graph: Mass of cart: _________ +/- ________ Force of friction: _________ +/- ________ 7. Compare the mass of the cart found by weighing it on the scale to the mass you found by graphing the acceleration curve. Do the two agree within uncertainties? Why did you succeed (or fail)? 8. Are the frictional forces the same for Run 1 and Run 2? Are we sure that the frictional force isn’t zero? Why? 5
