File
advertisement
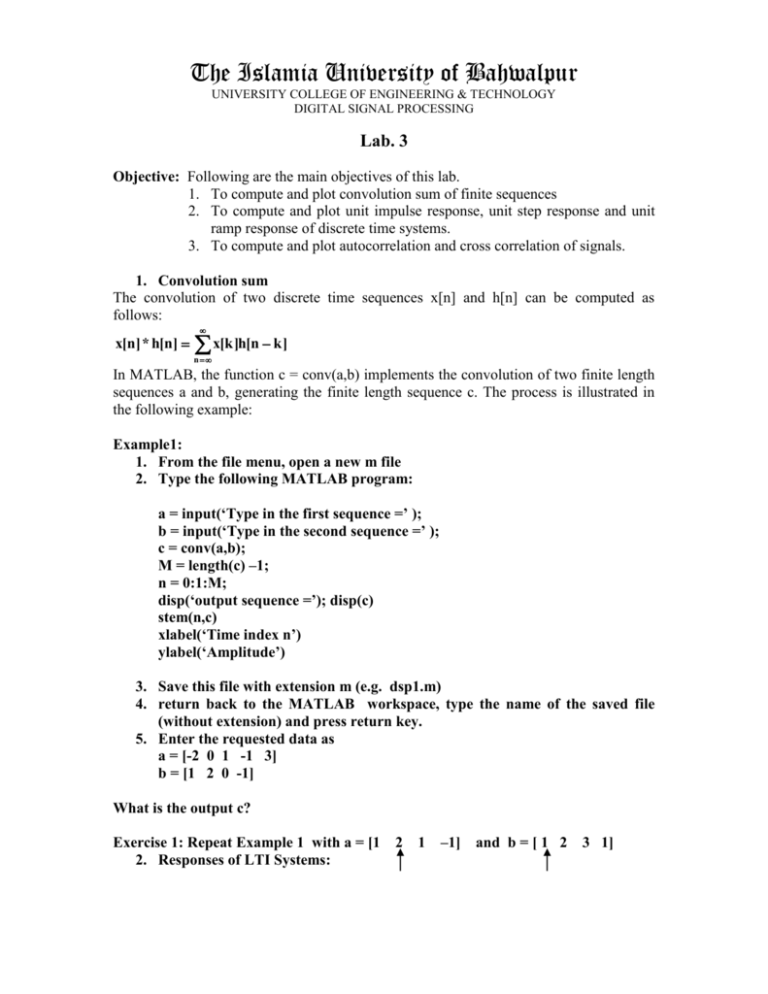
The Islamia University of Bahwalpur UNIVERSITY COLLEGE OF ENGINEERING & TECHNOLOGY DIGITAL SIGNAL PROCESSING Lab. 3 Objective: Following are the main objectives of this lab. 1. To compute and plot convolution sum of finite sequences 2. To compute and plot unit impulse response, unit step response and unit ramp response of discrete time systems. 3. To compute and plot autocorrelation and cross correlation of signals. 1. Convolution sum The convolution of two discrete time sequences x[n] and h[n] can be computed as follows: x[n] * h[n] x[k ]h[n k ] n In MATLAB, the function c = conv(a,b) implements the convolution of two finite length sequences a and b, generating the finite length sequence c. The process is illustrated in the following example: Example1: 1. From the file menu, open a new m file 2. Type the following MATLAB program: a = input(‘Type in the first sequence =’ ); b = input(‘Type in the second sequence =’ ); c = conv(a,b); M = length(c) –1; n = 0:1:M; disp(‘output sequence =’); disp(c) stem(n,c) xlabel(‘Time index n’) ylabel(‘Amplitude’) 3. Save this file with extension m (e.g. dsp1.m) 4. return back to the MATLAB workspace, type the name of the saved file (without extension) and press return key. 5. Enter the requested data as a = [-2 0 1 -1 3] b = [1 2 0 -1] What is the output c? Exercise 1: Repeat Example 1 with a = [1 2. Responses of LTI Systems: 2 1 –1] and b = [ 1 2 3 1] The response of a discrete time system to a unit sample (impulse) sequence is called the “unit sample response” or simply the “impulse response”. Correspondingly, the response of a discrete time system to a unit step sequence is its “unit step response”. The output y[n] of a causal LTI system can be simulated in MATLAB using the function “filter”. In one of its forms, the function y = filter(p, d, x) processes the input data vector x using the system characterized by the coefficient vectors p and d to generate the output vector y assuming zero initial conditions. The length of y is the same as the length of x. The following example illustrates the computation of the impulse and step responses of an LTI system. Example 2: Find impulse response and step response of the following LTI system: Y[n] + 0.7y[n-1] – 0.45y[n-2] – 0.6 y[n-3] = 0.8x[n] – 0.44x[n-1] + 0.36x[n-2] + 0.02x[n-3]. Solution: (a) Create and save and run the following MATLAB program to compute the impulse response: p = [0.8 –0.44 0.36 0.02]; d = [1 0.7 -0.45 -0.6]; N = 41; % Desired impulse response length x = [1 zeros(1,N-1)]; y = filter(p, d, x); k = 0:1:N-1; stem(k,y) xlabel(‘Time index n’) ylabel(‘Amplitude’) (b) To determine the step response we replace in the above program the statement x = [1 zeros(1,N-1)] with the statement x = [ones(1,N)]. Exercise: (a) Determine and sketch the unit ramp response of the system given in Example 2 above. (b) Determine the impulse response and the unit step response of the systems described by the difference equation y[n] = 0.7y[n-1] – 0.1y[n-2] + 2x[n] – x[n-2] (c) Sketch the response of the system characterized by the impulse response h[n] = 1 0 n 10 (1/2)nu[n] to the input signal x[n] 0, otherwise 3. Autocorrelation and Cross-correlation Function:
![Discrete-Time Impulse Signal [ ]](http://s2.studylib.net/store/data/010311668_1-3e941ee04d79d08bfadb9af68a3821e3-300x300.png)