DFDs Unit 2 Mod 1 Objectives 6-7
advertisement
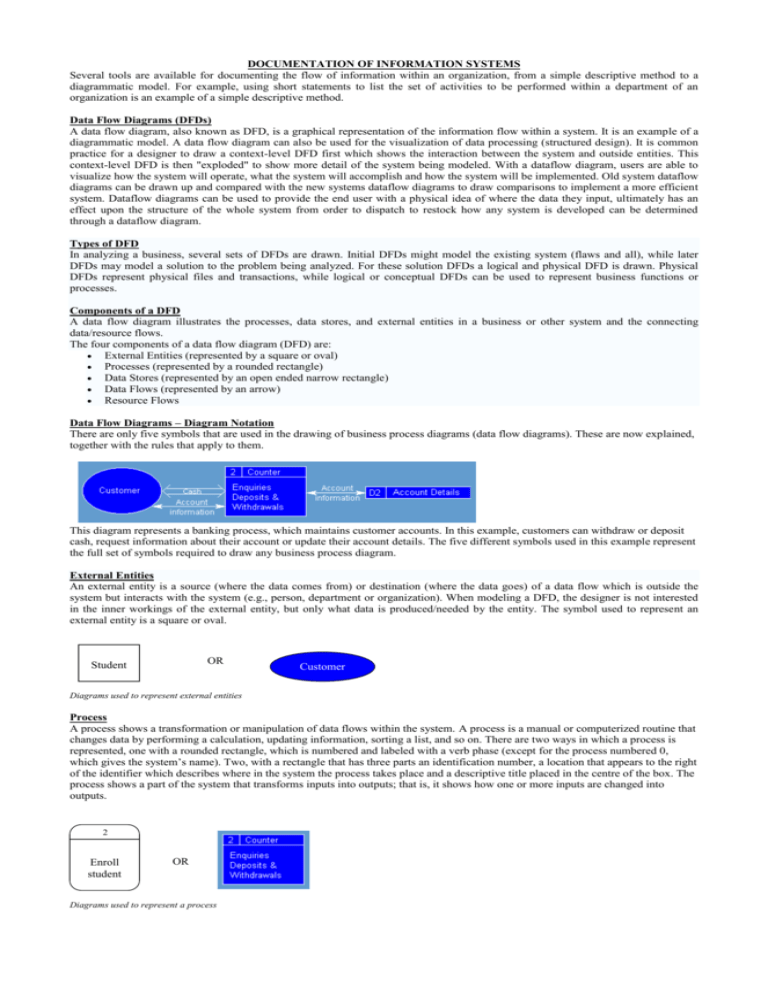
DOCUMENTATION OF INFORMATION SYSTEMS Several tools are available for documenting the flow of information within an organization, from a simple descriptive method to a diagrammatic model. For example, using short statements to list the set of activities to be performed within a department of an organization is an example of a simple descriptive method. Data Flow Diagrams (DFDs) A data flow diagram, also known as DFD, is a graphical representation of the information flow within a system. It is an example of a diagrammatic model. A data flow diagram can also be used for the visualization of data processing (structured design). It is common practice for a designer to draw a context-level DFD first which shows the interaction between the system and outside entities. This context-level DFD is then "exploded" to show more detail of the system being modeled. With a dataflow diagram, users are able to visualize how the system will operate, what the system will accomplish and how the system will be implemented. Old system dataflow diagrams can be drawn up and compared with the new systems dataflow diagrams to draw comparisons to implement a more efficient system. Dataflow diagrams can be used to provide the end user with a physical idea of where the data they input, ultimately has an effect upon the structure of the whole system from order to dispatch to restock how any system is developed can be determined through a dataflow diagram. Types of DFD In analyzing a business, several sets of DFDs are drawn. Initial DFDs might model the existing system (flaws and all), while later DFDs may model a solution to the problem being analyzed. For these solution DFDs a logical and physical DFD is drawn. Physical DFDs represent physical files and transactions, while logical or conceptual DFDs can be used to represent business functions or processes. Components of a DFD A data flow diagram illustrates the processes, data stores, and external entities in a business or other system and the connecting data/resource flows. The four components of a data flow diagram (DFD) are: External Entities (represented by a square or oval) Processes (represented by a rounded rectangle) Data Stores (represented by an open ended narrow rectangle) Data Flows (represented by an arrow) Resource Flows Data Flow Diagrams – Diagram Notation There are only five symbols that are used in the drawing of business process diagrams (data flow diagrams). These are now explained, together with the rules that apply to them. This diagram represents a banking process, which maintains customer accounts. In this example, customers can withdraw or deposit cash, request information about their account or update their account details. The five different symbols used in this example represent the full set of symbols required to draw any business process diagram. External Entities An external entity is a source (where the data comes from) or destination (where the data goes) of a data flow which is outside the system but interacts with the system (e.g., person, department or organization). When modeling a DFD, the designer is not interested in the inner workings of the external entity, but only what data is produced/needed by the entity. The symbol used to represent an external entity is a square or oval. OR Student Customer Diagrams used to represent external entities Process A process shows a transformation or manipulation of data flows within the system. A process is a manual or computerized routine that changes data by performing a calculation, updating information, sorting a list, and so on. There are two ways in which a process is represented, one with a rounded rectangle, which is numbered and labeled with a verb phase (except for the process numbered 0, which gives the system’s name). Two, with a rectangle that has three parts an identification number, a location that appears to the right of the identifier which describes where in the system the process takes place and a descriptive title placed in the centre of the box. The process shows a part of the system that transforms inputs into outputs; that is, it shows how one or more inputs are changed into outputs. 2 Enroll student OR Diagrams used to represent a process Data Store A data store is a holding place for information within the system. It is represented by an open ended narrow rectangle. Data stores may be long-term files such as sales ledgers, or may be short-term accumulations: for example batches of documents that are waiting to be processed. Each data store should be given a reference followed by an arbitrary number. It could represent the data being held manually or on a computer. Basically, a data store is a logical collection of data. D1 Student’s Records OR Diagram used to represent data store Data flow A data flow shows the flow of information from its source to its destination. A data flow is represented by a line, with arrowheads showing the direction of flow. Information always flows to or from a process or a data store and may be written, verbal or electronic. Diagram used to represent data flow Resource Flow A resource flow shows the flow of any physical material from its source to its destination. For this reason they are sometimes referred to as physical flows. The physical material in question should be given a meaningful name. Resource flows are usually restricted to early, high-level diagrams and are used when a description of the physical flow of materials is considered to be important to help the analysis. Diagram used to represent resource flow Rules governing how the diagram components relate to each other Data Flows For data flows the rules are as follows: Data flows and resource flows are allowed between external entities and processes. Data flows are also allowed between different external entities. However, data flows and resource flows are not allowed between external entities and data stores. Processes For processes the data flow rules are as follows: Data flows and resource flows are allowed between processes and external entities and between processes and data stores. They are also allowed between different processes. In other words processes can communicate with all other areas of the business process diagram. Data Stores For data stores the data flow rules are as follows: Data flows and resource flows are allowed between data stores and processes. However, these flows are not allowed between data stores and external entities or between one data store and another. In practice this means that data stores cannot initiate a communication of information, they require a process to do this. Data Flow Diagrams – Context Diagrams (Level 0 Diagram) The first step in constructing DFDs is to draw a context diagram. A context diagram is a top-level view of an information system that shows the system’s boundaries and scope. To draw a context diagram, you start by placing a single process symbol in the centre of the page. The symbol represents the entire system, and you identify it as process 0. Then you place the entities around the perimeter of the page and use data flows to connect the entities to the central process. You do not show any data stores in a context diagram because data stores are internal to the system. In drawing the context diagram you should only be concerned with the most important information flows. Remember that no data flow process diagram is the definitive solution - there is no absolute right or wrong. Context Diagram Example The context diagram shown above represents a book lending library. The library receives details of books, and orders books from one or more book suppliers. Books may be reserved and borrowed by members of the public, who are required to give a borrower number. The library will notify borrowers when a reserved book becomes available or when a borrowed book becomes overdue. In addition to supplying books, a book supplier will furnish details of specific books in response to library enquiries. Note, that communications involving external entities are only included where they involve the 'system' process. Whilst a book supplier would communicate with various agencies, for example, publishers and other suppliers - these data flow are remote from the 'system' process and so this is not included on the context diagram. Data Flow Diagrams – Level 1 Diagrams The level 1 diagram shows the main functional areas of the system under investigation. As with the context diagram, any system under investigation should be represented by only one level 1 diagram. There is no formula that can be applied in deciding what is, and what is not, a level 1 process. Level 1 processes should describe only the main functional areas of the system, and you should avoid the temptation of including lower level processes on this diagram. As a general rule no data flow diagram should contain more than 12 process boxes. The level 1 diagram is surrounded by the outline of a process box that represents the boundaries of the system. Because the level 1 diagram depicts the whole of the system under investigation, it can be difficult to know where to start. Some additional guidelines for creating DFDs: 1. 2. 3. 4. 5. 6. 7. 8. 9. 10. 11. All processes must have at least one data flow in and one data flow out. All processes should modify the incoming data, producing new forms of outgoing data. Each data store must be involved with at least one data flow. Each external entity must be involved with at least one data flow. A data flow must be attached to at least one process. Two entities, or two data stores, or an entity and a data store or vice versa, cannot be connected together with a data flow. Choose meaningful names for processes, flows, stores, and external entities. Number the processes. Avoid overly complex DFDs, do not cross lines. Make sure the DFD is internally consistent and consistent with any associated DFDs. The general principle in Data Flow Diagramming is that a system can be decomposed into subsystems, and subsystems can be decomposed into lower level subsystems, and so on. 12. Each subsystem represents a process or activity in which data is processed. At the lowest level, processes can no longer be decomposed. 13. Each process in a DFD has the characteristics of a system. 14. Data enters the system from the environment; data flows between processes within the system; and data is produced as output from the system. Dos and Don’ts 1. An Entity must be a noun (e.g. Member, Student, Customer etc.) 2. Two Data Stores, two Entities, or an Entity and a Data Store or vice versa, must not be directly connected. D1 D1 Video File Video File Member Student D1 Member Video File N.B. Always use one or more processes 3. A Process must have at least one Data Flow entering it and one leaving it. Video Number 1 Get Video Details Video Details 4. 1 Print airline tickets Ticket 2 Sort Serial numbers A Process that has no input is called a Miracle. It is impossible for an information system to process data it doesn’t have. 5. Serial numbers A Process that has no output is called a Black hole. A process that just does something to data, but doesn’t put that data anywhere is useless. 6. A Data Flow must not be split into two or more Data Flows 7. All Data Flows, Entities, Processes or Data Store must be labelled. 8. The Data Flow label leading to a Process must be different from the Data Flow label being outputted from that same Process. (If you put grapes into a blender and blend you will not get grapes when finished but grape juice) Example of a Data Flow Diagram This data flow diagram represents a system used in a video rental store. D1 Video File Video Record 1 Video Video Number 1 Video Details Get Video Details Member Details Member Member Number Bill Total 1 1 Get Member Details Get Payment Member Record D1 Compute Bill Total Payment Details Payment Member Member File 1 Member Record Print Receipt Class Activity Use the Data Flow Diagram below to answer the following questions. 1. How many processes are in the diagram? 2. Give the names of two of the processes. 3. What action is done to bill amount? 4. What is bill amount? 5. How many data stores are in the diagram 6. Name an external entity. Data Flow Diagrams – Practices Exercises Question 1 A student completes an application to become a member of a library. The student takes the application to the librarian who checks the form and then issue a membership card. The completed application is stored as Member Record in file, named Member Folder. To borrow books, a member takes the books and his membership card to the librarian. She updates her cards in the Book Folder. When a member returns the borrowed books to the library, the librarian updates her records. New books come into the library periodically. The librarian records the relevant details on cards, which are stored in the Book Folder. Required: Construct a Context Diagram (Level 0). Question 2 You have an address book in which you keep details of your friends. From time to time, you will make amendments such as change of address or telephone number for ‘old’ friend or add details for ‘new’ friends. In addition, a friend may request that you get the address or telephone number (from the address book) of another contact. Required: Construct a Context Diagram (Level 0.
