CENTRIPETAL FORCE (30 minutes) Exp
advertisement
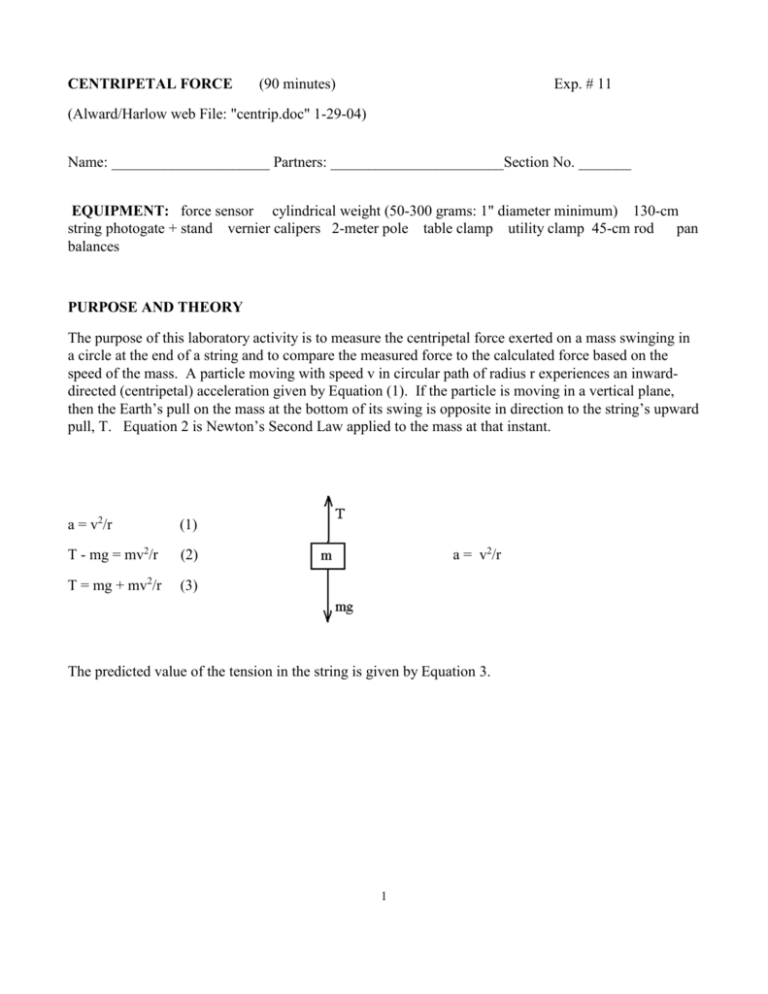
CENTRIPETAL FORCE (90 minutes) Exp. # 11 (Alward/Harlow web File: "centrip.doc" 1-29-04) Name: _____________________ Partners: _______________________Section No. _______ EQUIPMENT: force sensor cylindrical weight (50-300 grams: 1" diameter minimum) 130-cm string photogate + stand vernier calipers 2-meter pole table clamp utility clamp 45-cm rod pan balances PURPOSE AND THEORY The purpose of this laboratory activity is to measure the centripetal force exerted on a mass swinging in a circle at the end of a string and to compare the measured force to the calculated force based on the speed of the mass. A particle moving with speed v in circular path of radius r experiences an inwarddirected (centripetal) acceleration given by Equation (1). If the particle is moving in a vertical plane, then the Earth’s pull on the mass at the bottom of its swing is opposite in direction to the string’s upward pull, T. Equation 2 is Newton’s Second Law applied to the mass at that instant. a = v2/r (1) T - mg = mv2/r (2) T = mg + mv2/r (3) a = v2/r The predicted value of the tension in the string is given by Equation 3. 1 SETUP These steps may be skipped if a graph display of force versus velocity or the interface screen is already on the screen. 1. Turn on the signal interface, then turn on the computer. 2. Connect the force sensor’s plug into Analog Channel A on the interface. 3. Connect the photogate’s plug into Digital Channel 1 on the interface. 4. From the File pull-down menu, Open the file named "centrip.sws". PROCEDURE The swinging mass will be suspended from the hook at the bottom of the Pasco force sensor which will measure the tension in the string, and these values will be automatically recorded and plotted. 1. Place the photogate assembly on the floor (not on table). Attach 2-meter pole to side of table as close as possible to the black interface box, and connect 45-cm rod to utility clamp. Hang force sensor from the rod and tighten the lock nut so that the sensor will not wobble. 2. Attach a string of length 1.0 to 1.5 meters long to the hook at the bottom of the force sensor. At the end of the string hang an cylindrical object of mass m not less than 50 grams and not greater than 500 grams. Make sure that the cylinder is capable of fully blocking the photogate’s infra-red beam It is not necessary to adjust the length of the string; just raise or lower the photogate. Important: Adjust the position of the photogate so that the object is about one centimeter from the detector (located on the same side as the red indicator lamp). 2 3. Measure the distance r between the string’s knot on the hook and the center of the hanging mass (you will have to estimate the location of the center of the mass). This distance will be the radius of the circular path along which the mass will be swinging. Record this radius in Table II. 4. Use the vernier calipers to measure the actual diameter d' of the cylinder, and the pan balance to obtain its mass. Record both values in the table below. Since the first one millimeter of the object is needed to completely block the infrared beam, the effective length of the object will be assumed to be 1 mm less than the actual diameter; subtract 0.001 from the actual diameter, and record the effective diameter, d. TABLE 1: CYLINDRICAL WEIGHT Mass: m = _______________ kg Note: some of the cylindrical masses are marked 0.500 kg for use on the pan scales, but the actual mass is some other value. Make sure you record the actual value. Actual diameter: d' = ____________ m Effective diameter: d = d' - 0.001 = ______________________________ m 5. Calibrate the photogate. The speed of the swinging mass as it passes through the photogate beam is calculated by dividing the diameter of the cylinder by the travel time through the beam. This calculation is done by the computer software, but first it must be told the diameter of the cylinder. To enter the diameter, first click on Experiment, then select Setup; make the setup window big and delete any existing data sets. Click on the photogate icon (see Page 2). This will open up the Photogate Setup window. In the Object Length box, enter the diameter of the cylinder, then click OK. 3 6. When the the hook at the bottom of the force sensor is pulled, a special metal strip inside the sensor is stretched, causing a small electrical current to flow from the cable into the interface box. The amount of this current is measured in volts; the larger the pull, the greater the voltage reading. Thus, the voltage is proportional to the force. Even when there is no pull on the sensor, it still may generate a small voltage. We need to "zero" the sensor to cancel out this voltage. To zero the sensor, lift the string and hanging weight and place it temporarily on the table. Next, press the "tare" button on the side of the force sensor. This will zero the sensor. 7. Release the string and mass from a point approximately 45 degrees from vertical, and then press ALT-R. Make sure the mass does not hit the photogate, and also make sure that the mass passes through the gate at an angle which is perpendicular to the plane of the gate. After about six or seven swings, data collection will end. Force and velocity curves should appear on the screen. Note that there are many more force data points than velocity data points. This is because the force sensor collects data several times per second, while the photogate calculates velocity only when the mass crosses the gate. Note also that the force varies as time passes. This is because the angle changes. The force is maximum when the string is straight up and down, and is minimum when the mass is momentarily at rest at its two extreme positions to the left and right. We are only interested in the maximum values of the force; these maxima are at the peaks of the oscillating force curve. 8. Use the cross-hairs cursor to read the values of the force and velocity for five different points and record these values in Table II. Use pencil; in case your data is incorrect, you can erase it and start over. 9. For each velocity, calculate the predicted value of the force (the tension in the string) according to Equation 3, and record the result in Table II. 4 10. For each of the five sets of numbers, calculate the percentage difference between the actual measured tension and the predicted tension. The percentage difference is the absolute value of the difference between measured and predicted values, divided by the predicted value, times 100. TABLE II Length of pendulum: r = Number cm = Speed Measured Tension T (Newtons) v (m/s) m Predicted Tension Percent T = mg +mv2/r Difference (Newtons) % 1 2 3 4 5 Average: 5 %
