problem set 7 - Shepherd Webpages
advertisement
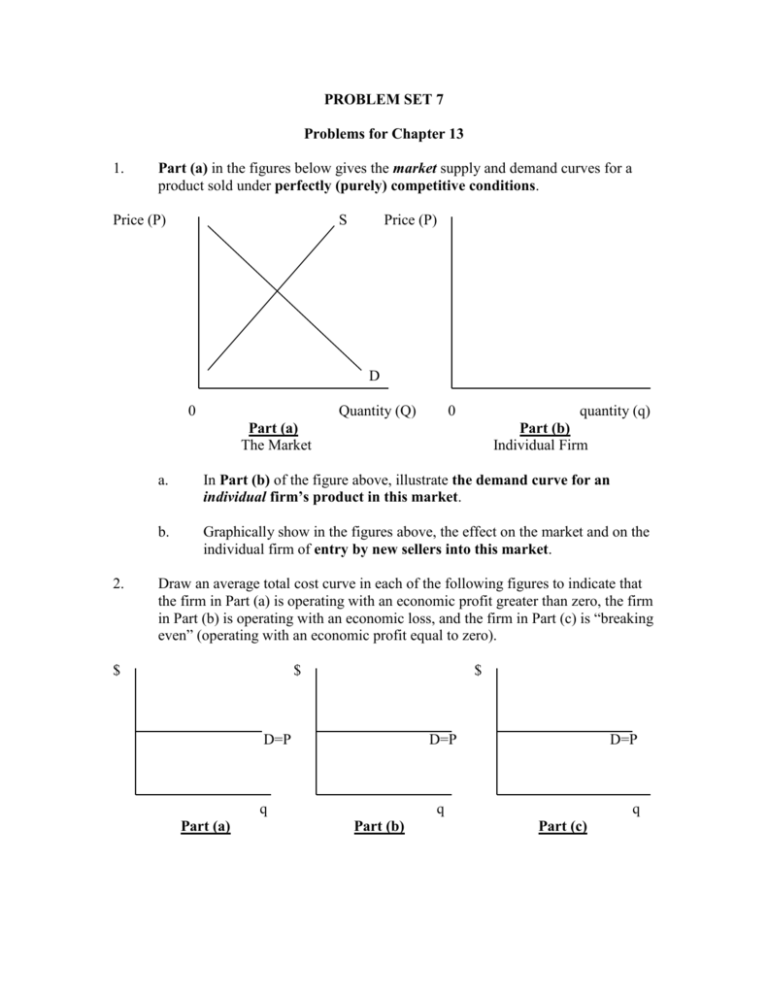
PROBLEM SET 7 Problems for Chapter 13 1. Part (a) in the figures below gives the market supply and demand curves for a product sold under perfectly (purely) competitive conditions. Price (P) S Price (P) D 0 Quantity (Q) 0 quantity (q) Part (a) The Market 2. Part (b) Individual Firm a. In Part (b) of the figure above, illustrate the demand curve for an individual firm’s product in this market. b. Graphically show in the figures above, the effect on the market and on the individual firm of entry by new sellers into this market. Draw an average total cost curve in each of the following figures to indicate that the firm in Part (a) is operating with an economic profit greater than zero, the firm in Part (b) is operating with an economic loss, and the firm in Part (c) is “breaking even” (operating with an economic profit equal to zero). $ $ $ D=P D=P q Part (a) D=P q Part (b) q Part (c) 2 3. The figure below belongs to a an individual perfectly (purely) competitive firm. Draw a long-run average total cost curve in this figure that is representative of the long-run position of a perfectly competitive firm and answer the question below the diagram. Price 10 9 8 7 6 5 D=P 4 3 2 1 0 1 2 3 4 5 6 7 8 9 10 11 Quantity (thousands of units) In the long-run, this firm will produce _______ units of output that will be sold for $______ each. 3 4. For each diagram below: a. Indicate whether the perfectly competitive firm is earning economic profit greater than or less than zero at the level of output (q1) it is currently producing. BONUS: What is the numerical value of the profit per unit that the firm is earning in each case? b. In each case, will new firms enter the industry or will firms exit the industry? c. In each case, what price will the firm charge when the industry gets to long-run equilibrium? Situation I $ ATC 100 75 50 D=P q* q1 Output (q) Situation II $ ATC 30 D=P 20 15 q1 q* Output (q) 4 5. 6. a. What does it mean when a firm operates with an economic profit greater than zero, an economic profit less than zero, or “breaks even” (economic profit equals zero)? b. Illustrate the following situations in a graph: i. A perfectly (purely) competitive firm in long-run equilibrium. ii. A monopolist earning an economic profit greater than zero. iii. A perfectly (purely) competitive firm operating with an economic profit less than zero. How do firms in perfect (pure) competition and monopoly differ in terms of: Number of rivals? Control over price? Ability to earn economic profit greater than zero over the long-run? Efficiency? 5 SELECTED ANSWERS 1. a. Price (P) S1 Price (P) A P1 P1 D1 D 0 Quantity (Q) Part (a) The Market 0 quantity (q) Part (b) Individual Firm The individual firm’s demand curve is horizontal at the market equilibrium price because each firm can sell as much output as it wants at the market price. 6 1. b. Price (P) S1 Price (P) S2 A P1 P1 D1 P2 D2 B P2 D 0 Quantity (Q) 0 quantity (q) Part (a) The Market Part (b) Individual Firm When new firms enter, the market supply curve shifts right (from S1 to S2). The individual firm’s demand curve shifts down from D1 to D2. 2. $ $ Part (a) ATC D=P ATC D=P q q Part (b) $ ATC D=P q Part (c) 3. The amount produced is determined by the output level where the long-run average total cost curve touches the demand curve. The exact level of output will depend on where the average total cost curve you drew touches the demand curve. This amount will be sold for $5. 4. Situation I: a. At q1: P = 50, ATC = 100 economic profit is less than zero. (Profit per unit = P – ATC = 50 – 100 = -50) b. Firms will exit. c. Price will rise to 75 because in long-run, equilibrium price = minimum average total cost. 7 Situation II: a. b. c. 5. a. At q1: P = 30, ATC = 20 economic profit is greater than zero. (Profit per unit = P – ATC = 30 – 20 = 10) Firms will enter. Price will fall to 15 because in long-run equilibrium, price = minimum average total cost. Economic profit greater than zero means that: the firm is earning an “above-normal” profit -OR The firm’s accounting profit exceeds the firm owner’s opportunity cost. (YOU figure out the rest!!) b.i. $ ATC ii. $ ATC P1 P1 D=P P=min. ATC Econ. Profit = 0 q1 b. iii. $ ATC1 q q1 ATC ATC1 P1 Econ. Profit < 0 D=P q1 q 6. Number of rivals: Control over price: Econ. Profit > 0 in long-run: Efficiency: Perfect Competiton Many None Not possible Yes D=P Econ. Profit>0 Monopoly None Maximum Possible No q
