Feb26
advertisement
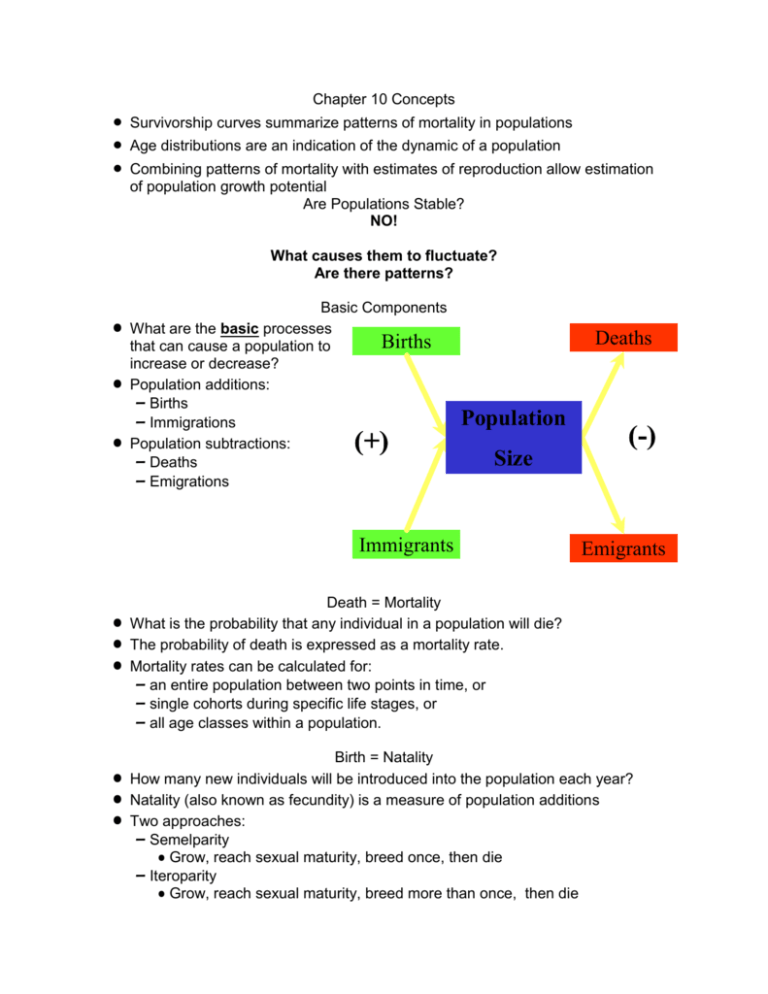
Chapter 10 Concepts Survivorship curves summarize patterns of mortality in populations Age distributions are an indication of the dynamic of a population Combining patterns of mortality with estimates of reproduction allow estimation of population growth potential Are Populations Stable? NO! What causes them to fluctuate? Are there patterns? • • • Basic Components What are the basic processes Births that can cause a population to increase or decrease? Population additions: – Births – Immigrations Population subtractions: – Deaths – Emigrations (+) Deaths Population Size Immigrants • • • • • • (-) Emigrants Death = Mortality What is the probability that any individual in a population will die? The probability of death is expressed as a mortality rate. Mortality rates can be calculated for: – an entire population between two points in time, or – single cohorts during specific life stages, or – all age classes within a population. Birth = Natality How many new individuals will be introduced into the population each year? Natality (also known as fecundity) is a measure of population additions Two approaches: – Semelparity • Grow, reach sexual maturity, breed once, then die – Iteroparity • Grow, reach sexual maturity, breed more than once, then die • • Iteroparous Breeders In general, fecundity is age specific in iteroparous breeders – “Young” breeders usually have low fecundity – “Experienced” breeders have increasing fecundity – Fecundity declines as old age approaches Calculation of “population fecundity rate” must take this into account. Life Tables • • Two basic types: – Dynamic or cohort life table • Follows fate of a single group born at the same time • Must be able to collect data on fates of significant portion of the population at frequent intervals – Static life table • Assesses age structure of population at a single point in time • Assumes that vital rates (birth and death) have been constant Both mortality and fecundity can be assessed with life tables • • • • Basic Calculation (Mortality) Start with a population of known individuals. Count all individuals that die from the beginning to the end of your time period. Divide the number dying by the number you started with. This is the mortality rate, or probability of death. Cohort Example n(x) = number of living individuals observed during time x d(x) = number dead in interval = n(x) n(x+1) m(x) = mortality rate = d(x)/n(x) l(x) = survivorship = n(x)/n(0) Age (x) n(x) d(x) m(x) l(x) e(x) 0 750 600 0.80 1.00 0.81 1 150 100 0.67 0.20 1.03 2 50 25 0.50 0.07 1.10 3 25 20 0.80 0.03 0.70 4 5 5 1.00 0.01 0.50 5 0 0 0.00 Basic Calculations (Fecundity) • Estimate survivorship rate [l(x)] • Survivorship = number alive at age (x) divided by number in original cohort [n(0)] • Estimate number of offspring produced per individual (female) in each age class [b(x)] • Multiply l(x) by b(x) to obtain survival weighted estimate of fecundity • Sum l(x)b(x) column to obtain expected number of offspring per individual in the original population Cohort Example • b(x) = number of offspring produced per female • l(x) * b(x) = number of offspring produced by each age class • R(0) = the number of offspring per cohort A g e (x) n (x) l(x) b (x) l(x)b (x) 0 750 1 .0 0 0 0 0 .0 0 0 1 150 0 .2 0 0 1 0 .2 0 0 2 50 0 .0 6 7 4 0 .2 6 7 3 25 0 .0 3 3 8 0 .2 6 7 4 5 0 .0 0 7 2 0 .0 1 3 5 0 0 .0 0 0 N et R eproductive R ate = R (0 ) • • • • • 0 .0 0 0 0 .7 4 7 Age Structure The distribution of individuals among age classes defines the “age structure” of a population. Age structure is determined by: – the probability of survival from one age to next – the number of individuals entering the population in a given year Age structure can tell us: – whether the population is expanding – patterns of survivorship (or mortality) Age Determination To determine age structure, we need two pieces of information: – the age of individuals in the population – the number of individuals in each age class Methods of aging include: – counting “annual rings” – condition of teeth – known age estimation Oak Tree Age Structure (Fig. 10.19) Population Structure of Cottonwoods (Fig. 10.20) Finches and Variable Environments (Fig. 10.21) Survivorship Curves (Fig. 10.18) • • • • • • Survivorship curves: – show the average number of individuals remaining in the population as a function of age class. – They are based on the fate of an initial “cohort” individuals. – A cohort is simply all individuals born during a single year or breeding period. Type I Low early mortality Once through “infancy”, high probability of survival to adulthood Mortality primarily due to senescence Type II Mortality is relatively constant across ages Sources of mortality affect age classes equally Type III • Very high early mortality • Once through “infancy”, high probability of survival to adulthood • Most individuals making it to the adult stage survive Chapter 11 Concepts With unlimited resources, populations will expand rapidly When resources are limited, populations will tend to remain at a constant level Resource limitations affect birth and death rates and population growth potential
