FinMan_Managerial_12e_TM_Ch27(12)_Final
advertisement
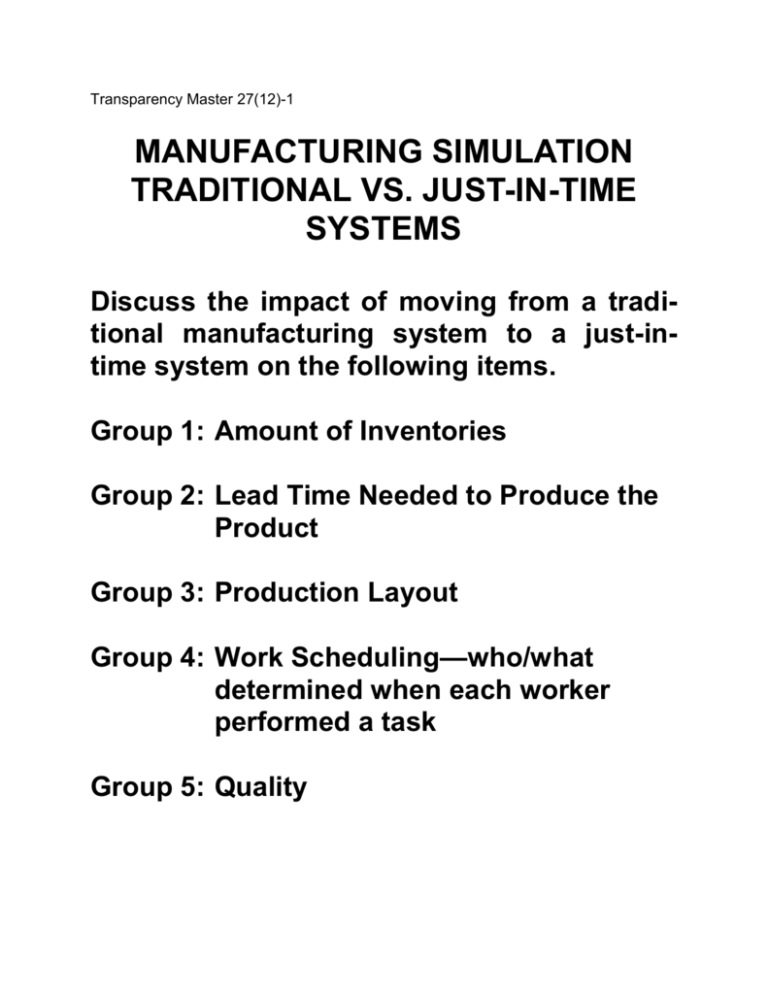
Transparency Master 27(12)-1 MANUFACTURING SIMULATION TRADITIONAL VS. JUST-IN-TIME SYSTEMS Discuss the impact of moving from a traditional manufacturing system to a just-intime system on the following items. Group 1: Amount of Inventories Group 2: Lead Time Needed to Produce the Product Group 3: Production Layout Group 4: Work Scheduling—who/what determined when each worker performed a task Group 5: Quality Transparency Master 27(12)-2 VALUE-ADDED & NON-VALUEADDED LEAD TIME Catalog Sales Company 1. Customer calls a 1-800 number. 2. If all operators are busy, the customer’s call is placed in a queue, waiting for an available operator. 3. Operator enters the customer’s order using a computerized order entry system. 4. The completed customer order is placed in a queue of orders waiting to be filled. Orders are pulled and packed in the order they were received. Most orders are pulled within 48 hours. 5. Items from the customer’s order form are pulled and placed in a box. 6. Box moves on a conveyor belt to the packaging area. 7. Packing material is added if necessary to avoid damage during shipment. The box is sealed and a mailing label is attached. 8. Box is moved to the shipping dock. 9. The box is stacked based on the carrier that will be used for delivery (UPS, FedEx, etc.). The box then sits until the appropriate carrier arrives. Transparency Master 27(12)-3 QUALITY COST CLASSIFICATIONS 1. Prevention 2. Appraisal 3. Internal Failure 4. External Failure Transparency Master 27(12)-4 PARETO CHART Quality Costs at Sycamore Manufacturing 200,000 175,000 Dollars 150,000 125,000 100,000 75,000 50,000 25,000 0 1 2 3 4 5 6 7 Activities Activity 1: Travel & Labor Costs for Warranty Repairs Activity 2: Cost of Defective Goods Produced Activity 3: Wages Paid to Quality Inspectors Activity 4: Parts for Warranty Repairs Activity 5: Vendor Certification Program Activity 6: Training for Machine Operators Activity 7: Preventive Maintenance on Machines Note: Sycamore Manufacturing’s total sales were $4,000,000. Transparency Master 27(12)-5 COST OF QUALITY REPORT SYCAMORE MANUFACTURING Quality Cost Classification Quality Cost Cost Summary Percent of Total Quality Cost Prevention $100,000 16% 3% Appraisal 125,000 20% 3% Internal Failure 150,000 24% 4% External Failure 250,000 40% 6% $625,000 100% 16% Total Percent of Total Sales Key: Activity Number 1. 2. 3. 4. 5. 6. 7. Quality Cost Classification External Failure Internal Failure Appraisal External Failure Prevention Prevention Prevention Transparency Master 27(12)-6 ACTIVITY ANALYSIS: RAW MATERIALS PROCUREMENT PROCESS AT LOGAN MANUFACTURING Raw Materials Procurement Activities Unload shipment Count quantity of materials & complete receiving report Inspect materials for quality Move materials to factory floor Total Activity Cost Percent of Total Process Cost Cost per Raw Materials Shipment (600 shipments per year) $18,000 20% $ 30 $12,000 13% $ 20 $51,000 57% $ 85 $ 9,000 10% $ 15 $90,000 100% $150
