Homework #3 Solutions
advertisement
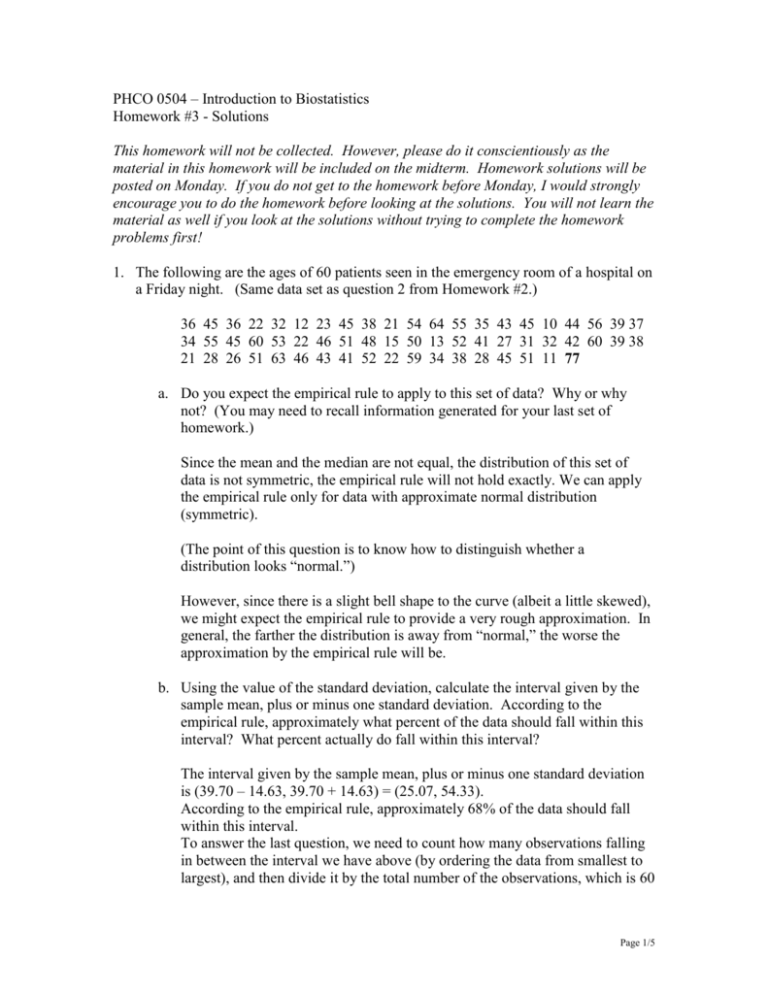
PHCO 0504 – Introduction to Biostatistics Homework #3 - Solutions This homework will not be collected. However, please do it conscientiously as the material in this homework will be included on the midterm. Homework solutions will be posted on Monday. If you do not get to the homework before Monday, I would strongly encourage you to do the homework before looking at the solutions. You will not learn the material as well if you look at the solutions without trying to complete the homework problems first! 1. The following are the ages of 60 patients seen in the emergency room of a hospital on a Friday night. (Same data set as question 2 from Homework #2.) 36 45 36 22 32 12 23 45 38 21 54 64 55 35 43 45 10 44 56 39 37 34 55 45 60 53 22 46 51 48 15 50 13 52 41 27 31 32 42 60 39 38 21 28 26 51 63 46 43 41 52 22 59 34 38 28 45 51 11 77 a. Do you expect the empirical rule to apply to this set of data? Why or why not? (You may need to recall information generated for your last set of homework.) Since the mean and the median are not equal, the distribution of this set of data is not symmetric, the empirical rule will not hold exactly. We can apply the empirical rule only for data with approximate normal distribution (symmetric). (The point of this question is to know how to distinguish whether a distribution looks “normal.”) However, since there is a slight bell shape to the curve (albeit a little skewed), we might expect the empirical rule to provide a very rough approximation. In general, the farther the distribution is away from “normal,” the worse the approximation by the empirical rule will be. b. Using the value of the standard deviation, calculate the interval given by the sample mean, plus or minus one standard deviation. According to the empirical rule, approximately what percent of the data should fall within this interval? What percent actually do fall within this interval? The interval given by the sample mean, plus or minus one standard deviation is (39.70 – 14.63, 39.70 + 14.63) = (25.07, 54.33). According to the empirical rule, approximately 68% of the data should fall within this interval. To answer the last question, we need to count how many observations falling in between the interval we have above (by ordering the data from smallest to largest), and then divide it by the total number of the observations, which is 60 Page 1/5 in this problem. We have 40 observations falling within this interval, so the actual percent that the sample falls within this interval would be 40/60 = 66.67%. In general, PLEASE do not round off these types of numbers to whole integers! As we discussed in class, it doesn’t necessarily make sense to do so! For example, a mean of integer numbers (1, 2, 3,…) is typically NOT an integer! If you obtain a “1” with probability of ½ and a “2” with a probability of ½, the mean is NOT a 1 or a 2; the mean is 1½=(1+2)/2. Also, note in this example that the integer ages presented in the data set are actually rounded off numbers. Only for a single moment out of the year out of one’s lifetime is someone actually exactly 16 years old. c. Repeat part b, using plus or minus two standard deviations. The interval given by the sample mean, plus or minus two standard deviations is (39.70 – 14.63 2, 39.70 + 14.63 2) = (10.44, 68.96). According to the empirical rule, approximately 95% of the data should fall within this interval. There are 58 observations falling within this interval, so the actual percent that the sample falls within this interval would be 58/60 = 96.67%. Please see the caution about rounding off to integer numbers above. d. Calculate and interpret a 95% confidence interval for the mean age of patients seen in the emergency room. (Note: The validity of this interval is based on the Central Limit Theorem, requiring a “large” sample size. With 60 patients it is reasonable to say that we have a large sample. However, it is possible that this is not really an independent, random sample. This is particularly true if we collected this information from all subjects at an ER on a particular Friday night and we are interested in all Friday nights over the course of a year. In this case, the assumption that we have an independent, random sample is violated.) A 95% confidence interval for the mean age of patients seen in the emergency room is (39.70 – 1.96*14.63/sqrt(60), 39.70 + 1.96*14.63/sqrt(60)) = (35.998, 43.402). Since the assumption of an independent, random sample is violated, this sample cannot represent the general population. We can only make inference about this particular sample. I am 95% confident that the mean age of patients seen in the emergency room of a particular hospital on a particular Friday night falls between 35.998 and 43.402. 2. The National Health and Nutrition Examination Survey of 1976-80, based on a random sample of men from the general U.S. population, found that the mean serum Page 2/5 cholesterol level for U.S. males aged 20-74 years was 211. The standard deviation was approximately 90. Consider a new experiment in which a sample of size 50 is drawn from the population of all US males between 20 and 74 years old. a. Which numbers (whether available or unavailable) would be used to graph the population distribution for this example? The Serum cholesterol levels for all U.S. males aged 20-74 years. On the x-axis would be the serum cholesterol levels; on the y-axis would be the relative frequencies. b. Which numbers would be used to graph the sample distribution for this example? Serum cholesterol level for the 50 U.S. males aged 20-74 years from the current sample. If we were to use a histogram, the x-axis would be divided into intervals representing the serum cholesterol levels; the y-axis would represent the counts or relative frequencies in each interval. c. With the observations available, can we graph the sampling distribution? Why or why not? We cannot graph the sampling distribution because we would need several sets of data from repeated experiments. Recall that the sampling distribution is the distribution of all possible values of the test statistic, in this case all possible values of the sample mean. d. What is the mean of the sampling distribution? What is the standard error? Interpret the value for the standard error. What is the approximate shape of the sampling distribution? The mean for the sampling distribution has the same value as the population mean, 211, because the sampling distribution is the distribution of the sample mean, which is an unbiased estimator of the population mean. The standard error is the standard deviation divided by square root of sample size, that is, 90/sqrt(50) = 12.7279. The value for the standard error tells how far we are from estimate population mean. The approximate shape of the sampling distribution would be bell-shaped, Gaussian (normal) distribution, due to the Central Limit Theorem. Page 3/5 3. The study cited in the previous problem also looked at a subpopulation, men aged 2024 years. The average reported serum cholesterol level was 180. The standard deviation was approximately 43. a. Explain why you might expect the standard deviation for this target population to be so much smaller than that of the target population in the previous problem. The subpopulation of men aged 20-24 years includes a group of men that are much more similar to each other than the group of men between 20 and 74 years old. Because they are more similar, there will be smaller differences between them and the spread of serum cholesterol levels will be much smaller. b. Suppose you randomly selected and sampled a particular man who was 23 years old and measured his serum cholesterol level to be 287.5. Assuming that the serum cholesterol levels are distributed according to a Gaussian (normal) distribution, using normal probabilities, describe where this man falls in relation to the rest of the population. (How many standard deviations is he above the mean? Does his value fall within the same interval that 68% of the population falls? 95% of the population? Is this man unusual with respect to his cholesterol level.) The z-score is (287.5 – 180)/43 = 2.5. So, his serum cholesterol level is 2.5 standard deviations above the mean. From the normal table, it gives us 98.76%, which means that 98.76% is the probability of falling 2.5 standard deviations of the mean. So, his value does not fall within the same interval that 68% nor 95% of the population falls. This man is unusual with respect to his cholesterol level. c. Suppose that you randomly select a simple random sample of size 60 from the subpopulation of men aged 20 to 24 years. Find the probability that the sample mean serum cholesterol level will be between 170 and 190. We can write the probability as P(170 < Y < 190). After standardizing it, we have 170-mean Y - mean 190 - mean P( ------------- < --------------- < --------------- ) SEM SEM SEM = P(-1.8014 < Z < 1.8014), (SEM = 5.551276, mean = 180) where Z follows a standard normal distribution. Then, we can find the probability from the normal table, which is 92.81%. Page 4/5 4. Suppose that in an independent experiment, you sample 60 men aged 20-24 who regularly work out at a local gym. You find that the sample mean and standard deviation for this sample are 165 and 40, respectively. a. Calculate the 95% confidence interval for the population mean based on this mean and standard deviation (165 and 40). Use z-interval. We have SEM = 40 / sqrt(60) = 5.1640, and z-score = 1.96 for 95% confidence interval.. So the 95% confidence interval for the population mean is (154.8786, 175.1214). b. Which population does this sample represent? This sample represents the population of men (who work out regularly) aged 20-24. c. Give a formal interpretation of the confidence interval (I am 95% confident that …). I am 95% confident that the mean serum cholesterol level for men aged 20-24 who regularly work out at a local gym falls between 154.8786 and 175.1214. d. Make a conclusion using the information given above about whether the mean of the current population is the same as the national average for the men aged 20 to 24 as determined by the National Health and Nutrition Examination Survey. Since the average reported serum cholesterol level was 180 in the study, which is not included in the 95% confidence interval here, the mean of the current population is not the same as (is lower than) the national average for the same aged men. Page 5/5


