Reports: An Example Model
Reports: An Example Model
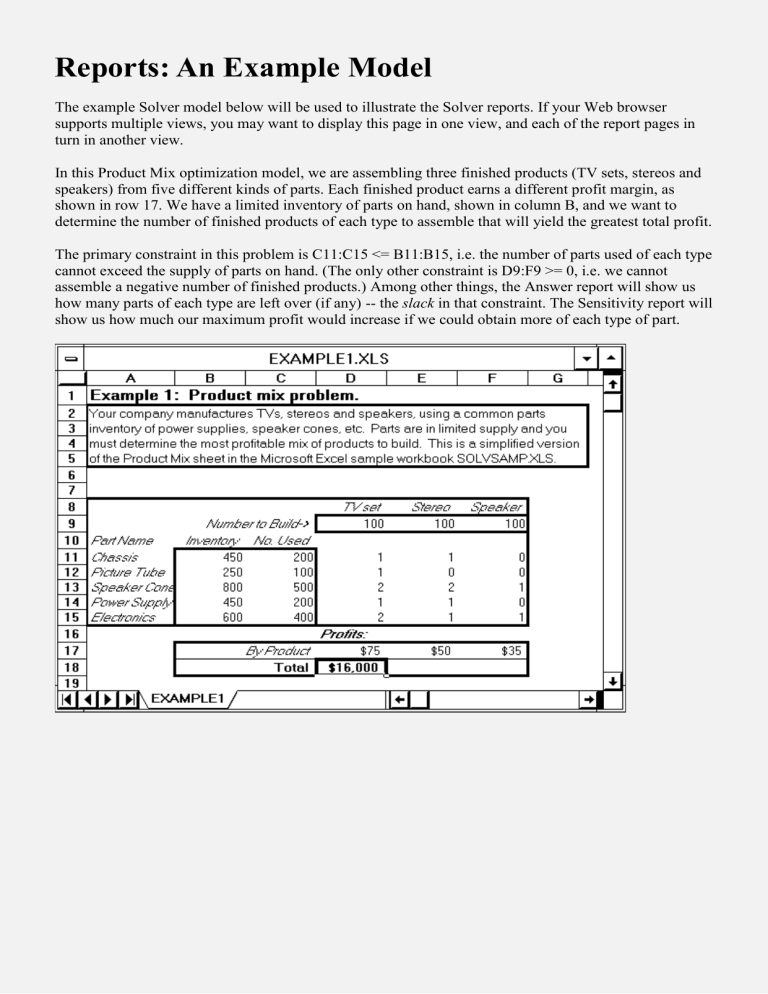
The example Solver model below will be used to illustrate the Solver reports. If your Web browser supports multiple views, you may want to display this page in one view, and each of the report pages in turn in another view.
In this Product Mix optimization model, we are assembling three finished products (TV sets, stereos and speakers) from five different kinds of parts. Each finished product earns a different profit margin, as shown in row 17. We have a limited inventory of parts on hand, shown in column B, and we want to determine the number of finished products of each type to assemble that will yield the greatest total profit.
The primary constraint in this problem is C11:C15 <= B11:B15, i.e. the number of parts used of each type cannot exceed the supply of parts on hand. (The only other constraint is D9:F9 >= 0, i.e. we cannot assemble a negative number of finished products.) Among other things, the Answer report will show us how many parts of each type are left over (if any) -- the slack in that constraint. The Sensitivity report will show us how much our maximum profit would increase if we could obtain more of each type of part.
The Answer Report
The Answer Report provides basic information about the decision variables and the constraints, with their original and final values. It also gives you a quick way to determine which constraints are "binding" or satisfied with equality at the solution, and which constraints have slack. An example Answer Report for the Solver model EXAMPLE1.XLS is shown below.
First shown are the objective function (target cell) and decision variables (adjustable or changing cells), with their original value and final values. Next are the constraints, with their final cell values; a formula representing the constraint; the "status" binding or non-binding of the constraint; and the slack value: The difference between the final value and the lower or upper bound imposed by that constraint.
A binding constraint, which is satisfied with equality, will always have a slack of zero. (In the standard
Microsoft Excel Solver, an exception to this occurs when the right hand side of a constraint is itself a function of the decision variables. In Frontline's enhanced solvers, this special case is handled differently, and the slack value for a binding constraint will always be zero.)
Note: When creating a report, the Solver constructs the entries in the Name column by searching for the first text cell to the left and the first text cell above each adjustable (changing) cell and each constraint cell. If you lay out your Solver model in tabular form, with text labels in the leftmost column and topmost row, these entries will be most the most useful -- as in the example above. Also note that the formatting
for the Original Value, Final Value and Cell Value is "inherited" from the formatting of the corresponding cell in the Solver model.
The Sensitivity Report
The Sensitivity Report provides classical sensitivity analysis information for both linear and nonlinear programming problems, including dual values (in both cases) and range information (for linear problems only). The dual values for (nonbasic) variables are called Reduced Costs in the case of linear programming problems, and Reduced Gradients for nonlinear problems. The dual values for (binding) constraints are called Shadow Prices for linear programming problems, and Lagrange Multipliers for nonlinear problems.
Dual Values for Nonlinear Models
An example of a Sensitivity Report generated for EXAMPLE1.XLS when the Assume Linear Model box is not checked is shown below. Note that it includes only the solution values and the dual values: Reduced
Gradients for variables and Lagrange Multipliers for constraints.
Constraints which are simple upper and lower bounds on the variables that you enter in the Constraints list box of the Solver Parameters dialog are treated specially (for efficiency reasons) by both the linear and nonlinear Solver algorithms, and will not appear in the Constraints section of the Sensitivity report.
Note: The formatting of the Final Value, Reduced Gradient and Lagrange Multiplier cells in the report is
"inherited" from the corresponding cells in the Solver model. In the example above, the cells in the model were formatted to display as integers (0 decimal places), so the entries in the report are formatted the same way. If you select the cell displayed as -2 (the Reduced Gradient for Speakers), you'll see that the actual value is -2.4999... which has been rounded down to -2. Bear this in mind when designing your model and when reading the report. Since the report is a worksheet , you can always change the cell formatting with the Format menu.
Interpreting Dual Values
Dual values are the most basic form of sensitivity analysis information. The dual value for a variable is nonzero only when the variable's value is equal to its upper or lower bound (usually zero) at the optimal solution. This is called a nonbasic variable, and its value was driven to the bound during the optimization process. Moving the variable's value away from the bound will worsen the objective function's value; conversely, "loosening" the bound will improve the objective. The dual value measures the increase in the objective function's value per unit increase in the variable's value. In the example above, the dual value for producing speakers is -2, meaning that if we were to build one speaker (and therefore less of something else), our total profit would decrease by $2 (about $2.50 without the rounding due to cell formatting).
The dual value for a constraint is nonzero only when the constraint is equal to its bound. This is called a binding constraint, and its value was driven to the bound during the optimization process. Moving the constraint left hand side's value away from the bound will worsen the objective function's value; conversely, "loosening" the bound will improve the objective. The dual value measures the increase in the objective function's value per unit increase in the constraint's bound. In the example Sensitivity Report below, increasing the number of electronics units from 600 to 601 will allow the Solver to increase total profit by $25.
If you are not accustomed to analyzing sensitivity information for nonlinear problems, you should bear in mind that the dual values are valid only at the single point of the optimal solution -- if there is any curvature involved, the dual values begin to change (along with the constraint gradients) as soon as you move away from the optimal solution. In the case of linear problems, the dual values remain constant over the range of Allowable Increases and Decreases in the variables' objective coefficients and the constraints' right hand sides, respectively.
Dual Values and Ranges for Linear Models
In linear programming problems, unlike nonlinear problems, the dual values are constant over a range of possible changes in the objective function coefficients and the constraint right hand sides. The Sensitivity
Report for linear programming models includes this range information.
A Sensitivity Report for EXAMPLE1.XLS when the Assume Linear Model box is checked is shown below. In addition to the dual values (Reduced Costs for variables, Shadow Prices for constraints), this report provides information about the range over which these values will remain valid.
Note: The formatting of the Final Value, Reduced Cost and Objective Coefficient cells in the report is
"inherited" from the corresponding cells in the Solver model. In the example above, the cells in the model were formatted to display as integers (0 decimal places), so these entries are formatted the same way. If you select the cell displayed as -2 (the Reduced Cost for Speakers), you'll see that the actual value is -
2.4999... which has been rounded down to -2. Bear this in mind when designing your model and when reading the report. Since the report is a worksheet , you can always change the cell formatting with the
Format menu.
Interpreting Dual Values and Range Information
The dual values (Reduced Costs and Shadow Prices) have the same interpretation for linear models as they have for nonlinear models (see Interpreting Dual Values). In the example above, the Reduced Cost for producing speakers is -2, meaning that if we were to build one speaker (and therefore less of something else), our total profit would decrease by $2 (about $2.50 without the rounding due to cell formatting). The Shadow Price for electronics units is 25, so an extra electronics unit would allow the
Solver to increase total profit by $25.
For each decision variable, the report shows its coefficient in the objective function, and the amount by which this coefficient could be increased or decreased without changing the dual value. In the example below, we'd still build 200 TV sets even if the profitability of TV sets decreased up to $5 per unit (beyond that point, or if the unit profit of speakers increased by more than $2.50, we'd start building speakers).
For each constraint, the report shows the constraint right hand side, and the amount by which the "R.H.
Side" could be increased or decreased without changing the dual value. In this example, we could use up to 50 more electronics units, which we'd use to build more TV sets instead of stereos, increasing our profits by $25 per unit. Beyond 650 units, we would switch to building speakers at an incremental profit of $20 per unit (a new dual value).
A value of 1E+30 in these reports represents "infinity:" For example, we are currently not building any speakers, and we would continue to build no speakers regardless of how much the unit profit of speakers was decreased .
The Limits Report
The Limits Report was designed by Microsoft to provide a different kind of "sensitivity analysis" information. It is created by re-running the optimization model with each decision variable (changing cell) in turn as the objective (both maximizing and minimizing), and all other variables held fixed. Hence, it shows a "lower limit" for each variable, which is the smallest value that a variable can take while satisfying the constraints and holding all of the other variables constant, and an "upper limit," which is the largest value the variable can take under these circumstances. An example of the Limits Report for
EXAMPLE1.XLS is shown below.
Copyright © 1996 Frontline Systems Inc.
Last modified: December 01, 1996
