Some solutions to Chapter 4 problems
advertisement
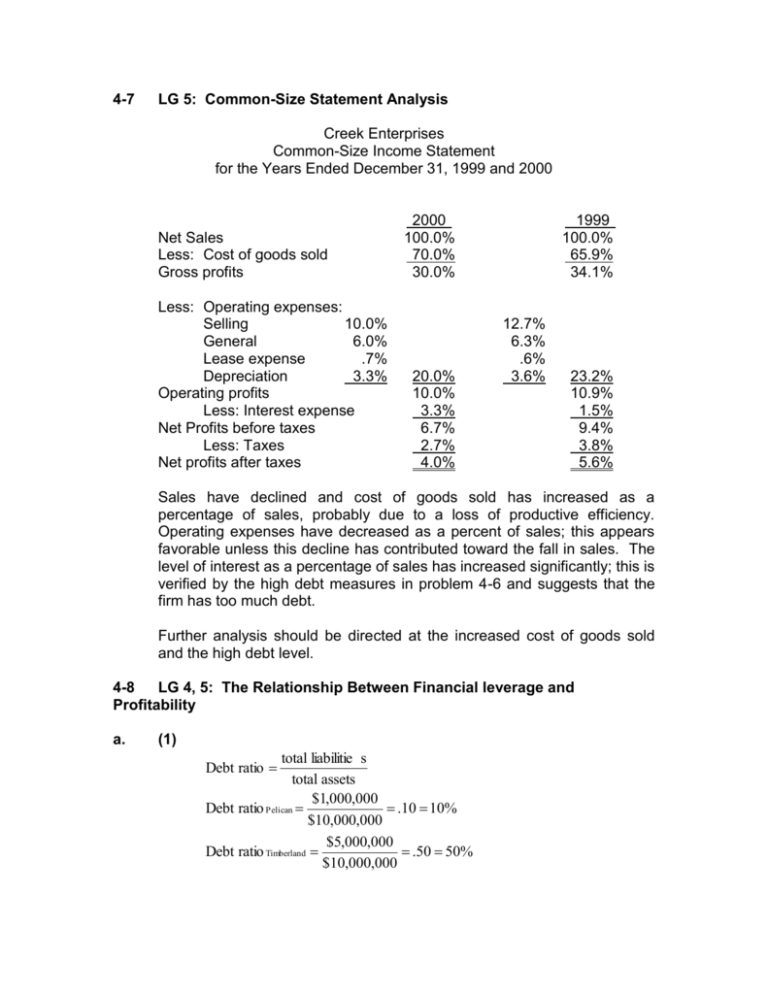
4-7 LG 5: Common-Size Statement Analysis Creek Enterprises Common-Size Income Statement for the Years Ended December 31, 1999 and 2000 Net Sales Less: Cost of goods sold Gross profits Less: Operating expenses: Selling 10.0% General 6.0% Lease expense .7% Depreciation 3.3% Operating profits Less: Interest expense Net Profits before taxes Less: Taxes Net profits after taxes 2000 100.0% 70.0% 30.0% 20.0% 10.0% 3.3% 6.7% 2.7% 4.0% 1999 100.0% 65.9% 34.1% 12.7% 6.3% .6% 3.6% 23.2% 10.9% 1.5% 9.4% 3.8% 5.6% Sales have declined and cost of goods sold has increased as a percentage of sales, probably due to a loss of productive efficiency. Operating expenses have decreased as a percent of sales; this appears favorable unless this decline has contributed toward the fall in sales. The level of interest as a percentage of sales has increased significantly; this is verified by the high debt measures in problem 4-6 and suggests that the firm has too much debt. Further analysis should be directed at the increased cost of goods sold and the high debt level. 4-8 LG 4, 5: The Relationship Between Financial leverage and Profitability a. (1) total liabilitie s total assets $1,000,000 Debt ratio Pelican .10 10% $10,000,000 $5,000,000 Debt ratio Timberland .50 50% $10,000,000 Debt ratio (2) earning before interest and taxes interest $6,250,000 Times interest earned Pelican 62.5 $100,000 $6,250,000 Times interest earned Timberland 12.5 $500,000 Times interest earned Timberland has a much higher degree of financial leverage than does Pelican. As a result Timberland's earnings will be more volatile, causing the common stock owners to face greater risk. This additional risk is supported by the significantly lower times interest earned ratio of Timberland. Pelican can face a very large reduction in net income and still be able to cover its interest expense. b. (1) operating profit sales $6,250,000 Operating profit margin Pelican .25 25% $25,000,000 $6,250,000 Operating profit margin Timberland .25 25% $25,000,000 Operating profit margin (2) net income sales $3,690,000 Net profit margin Pelican .1476 14.76% $25,000,000 $3,450,000 Net profit margin Timberland .138 13.80% $25,000,000 Net profit margin (3) net profit after taxe s total assets $3,690,000 Return on assets Pelican .369 36.9% $10,000,000 $3,450,000 Return on assets Timberland .345 34.5% $10,000,000 Return on assets (4) net profit after taxe s stockholde rs equity $3,690,000 Return on equity Pelican .41 41.0% $9,000,000 $3,450,000 Return on equity Timberland .69 69.0% $5,000,000 Return on equity Pelican is more profitable than Timberland, as shown by the higher operating profit margin, net profit margin, and return on assets. However, the return on equity for Timberland is higher than that of Pelican. (c) Even though Pelican is more profitable, Timberland has a higher ROE than Pelican due to the additional financial leverage. The lower profits of Timberland are due to the fact that interest expense is deducted from EBIT. Timberland has $500,000 of interest expense to Pelican's $100,000. Even after the tax shield from the interest tax deduction ($500,000 x .40 = $200,000) Timberland's profits are less than Pelican's by $240,000. Since Timberland has a higher relative amount of debt, the stockholders' equity is proportionally reduced resulting in the higher return to equity than that obtained by Pelican. The higher ROE is at the expense of higher levels of risk faced by Timberland equity holders. 4-13 LG 6: Integrative-Complete Ratio Analysis Ratio Analysis Sterling Company Actual 1998 Ratio sectional Net working capital $760 (000) Actual 1999 Actual 2000 Industry Average 2000 $720 $800 $1,600 TS: Time-series CS: CrossTS: Stable CS: Poor Current ratio 1.40 1.55 1.67 1.85 TS: Improving CS: Fair Quick ratio 1.00 .92 .88 1.05 TS: Deteriorating CS: Poor Inventory turnover 9.52 9.21 7.89 8.60 TS: Deteriorating CS: Fair Average collection 45.0 days 36.4 days 28.8 days period 35 days TS: Improving CS: Good Average payment 58.5 days 60.8 days 52.3 days period 45.8 days TS: Unstable CS: Poor Fixed asset turnover1.08 1.05 1.11 1.07 TS: Unstable CS: Good Total asset turnover 0.74 0.80 .83 0.74 TS: Improving CS: Good Industry Average 2000 Ratio sectional Debt ratio Actual 1998 Actual 1999 Actual 2000 0.20 0.20 0.35 0.30 TS: Increasing CS: Fair Debt-equity ratio 0.25 0.27 0.38 0.39 TS: Increasing CS: Good Times interest earned8.2 7.3 6.5 8.0 TS: Deteriorating CS: Poor Fixed payment coverage ratio 4.5 4.2 2.7 4.2 TS: Deteriorating CS: Poor Gross profit margin 0.30 0.27 0.25 0.25 TS: Deteriorating CS: Good Operating profit margin 0.12 0.12 0.13 0.10 TS: Improving CS: Good Net profit margin 0.067 0.067 0.066 0.058 Return on investment (ROA) 0.049 0.054 0.055 0.043 0.073 0.085 0.072 Return on equity (ROE) 0.066 TS: Time-series CS: Cross- TS: Stable CS: Good TS: Improving CS: Good TS: Improving CS: Good Earnings per share$1.75 (EPS) Price/earnings (P/E) 12.0 $2.20 $3.05 $1.50 10.5 9.0 11.2 TS: Improving CS: Good TS: Deteriorating CS: Poor Liquidity: Sterling Company's overall liquidity as reflected by the current ratio, net working capital, and acid-test ratio appears to have remained relatively stable but is below the industry average. Activity: The activity of accounts receivable has improved, but inventory turnover has deteriorated and is currently below the industry average. The firm's average payment period appears to have improved from 1998, although the firm is still paying slower than the average company. Debt: The firm's debt ratios have increased from 1998 and are very close to the industry averages, indicating currently acceptable values but an undesirable trend. The firm's fixed payment coverage has declined and is below the industry average figure, indicating a deterioration in servicing ability. Profitability: The firm's gross profit margin, while in line with the industry average, has declined, probably due to higher cost of goods sold. The operating and net profit margins have been stable and are also in the range of industry averages. Both the return on total assets and return on equity appear to have improved slightly and are better than the industry averages. Earnings per share made a significant increase in 1999 and 2000. The P/E ratio indicates a decreasing degree of investor confidence in the firm's future earnings potential, perhaps due to the increased debt load and higher servicing requirements. In summary, the firm needs to attend to inventory and accounts payable and should not incur added debts until their leverage and fixed charge coverage ratios are improved. Other than these indicators, the firm appears to be doing wellespecially in generating return on sales.

