Word - American Economic Association
advertisement
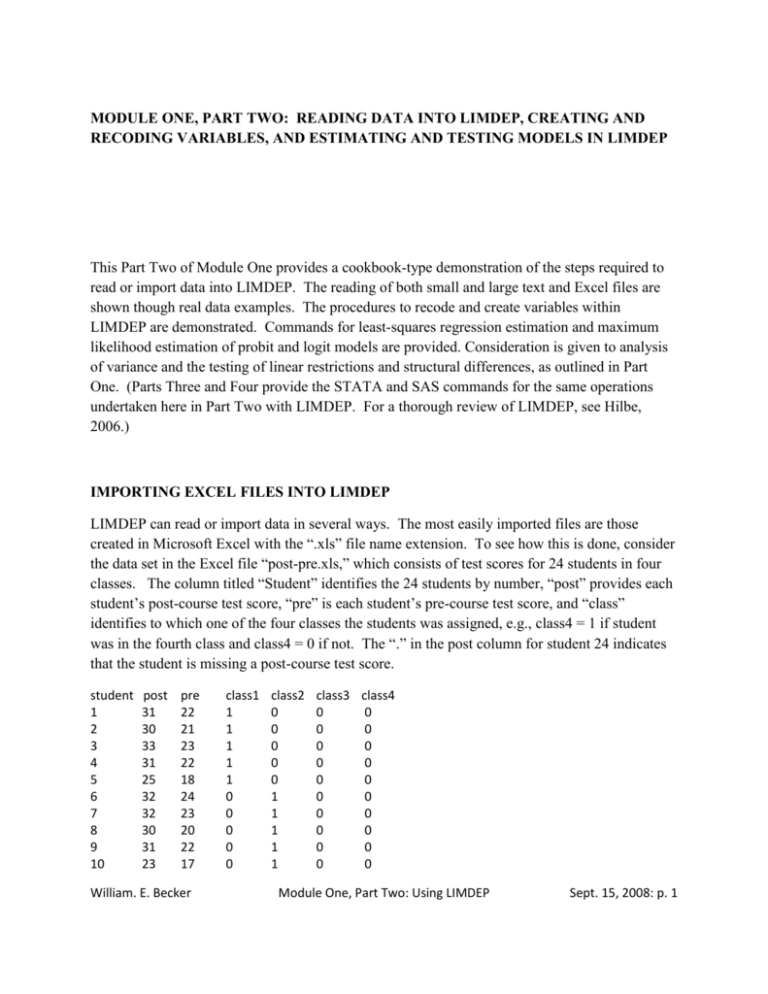
MODULE ONE, PART TWO: READING DATA INTO LIMDEP, CREATING AND RECODING VARIABLES, AND ESTIMATING AND TESTING MODELS IN LIMDEP This Part Two of Module One provides a cookbook-type demonstration of the steps required to read or import data into LIMDEP. The reading of both small and large text and Excel files are shown though real data examples. The procedures to recode and create variables within LIMDEP are demonstrated. Commands for least-squares regression estimation and maximum likelihood estimation of probit and logit models are provided. Consideration is given to analysis of variance and the testing of linear restrictions and structural differences, as outlined in Part One. (Parts Three and Four provide the STATA and SAS commands for the same operations undertaken here in Part Two with LIMDEP. For a thorough review of LIMDEP, see Hilbe, 2006.) IMPORTING EXCEL FILES INTO LIMDEP LIMDEP can read or import data in several ways. The most easily imported files are those created in Microsoft Excel with the “.xls” file name extension. To see how this is done, consider the data set in the Excel file “post-pre.xls,” which consists of test scores for 24 students in four classes. The column titled “Student” identifies the 24 students by number, “post” provides each student’s post-course test score, “pre” is each student’s pre-course test score, and “class” identifies to which one of the four classes the students was assigned, e.g., class4 = 1 if student was in the fourth class and class4 = 0 if not. The “.” in the post column for student 24 indicates that the student is missing a post-course test score. student 1 2 3 4 5 6 7 8 9 10 post 31 30 33 31 25 32 32 30 31 23 pre 22 21 23 22 18 24 23 20 22 17 William. E. Becker class1 1 1 1 1 1 0 0 0 0 0 class2 0 0 0 0 0 1 1 1 1 1 class3 class4 0 0 0 0 0 0 0 0 0 0 0 0 0 0 0 0 0 0 0 0 Module One, Part Two: Using LIMDEP Sept. 15, 2008: p. 1 11 12 13 14 15 16 17 18 19 20 21 22 23 24 22 21 30 21 19 23 30 31 20 26 20 14 28 . 16 15 19 14 13 17 20 21 15 18 16 13 21 12 0 0 0 0 0 0 0 0 0 0 0 0 0 0 1 1 0 0 0 0 0 0 0 0 0 0 0 0 0 0 1 1 1 1 1 1 0 0 0 0 0 0 0 0 0 0 0 0 0 0 1 1 1 1 1 1 To start, the file “post-pre.xls” must be downloaded and copied to your computer’s hard drive. Once this is done open LIMDEP. Clicking on “Project,” “Import,” and “Variables…” yields the following screen display: William. E. Becker Module One, Part Two: Using LIMDEP Sept. 15, 2008: p. 2 Clicking “Variable” gives a screen display of your folders in “My Documents,” in which you can locate files containing Excel ( .wk and .xls) files. The next slide shows a path to the file “post-pre.xls.” (The path to your copy of “post-pre.xls” will obviously depend on where you placed it on your computer’s hard drive.) Clicking “Open” imports the file into LIMDEP. William. E. Becker Module One, Part Two: Using LIMDEP Sept. 15, 2008: p. 3 To make sure the data has been correctly imported into LIMDEP, click the “Activate Data Editor” button, which is second from the right on the tool bar or go to Data Editor in the Window’s menu. Notice that the missing observation for Student 24 appears as a blank in this data editor. The sequencing of these steps and the associated screens follow: William. E. Becker Module One, Part Two: Using LIMDEP Sept. 15, 2008: p. 4 William. E. Becker Module One, Part Two: Using LIMDEP Sept. 15, 2008: p. 5 William. E. Becker Module One, Part Two: Using LIMDEP Sept. 15, 2008: p. 6 READING SPACE DELINEATED TEXT FILES INTO LIMDEP Next we consider externally created text files that are typically accompanied by the “.txt” or “.prn” extensions. For demonstration purposes, the data set we just employed with 24 observations on the 7 variables (“student,” “post,” “pre,” “class1,” “class2,” “class3,” and “class4”) was saved as the space delineated text file “post-pre.txt.” After downloading this file to your hard drive open LIMDEP to its first screen: To read the file “post-pre.txt,” begin by clicking “File” in the upper left-hand corner of the ribbon, which will yield the following screen display: William. E. Becker Module One, Part Two: Using LIMDEP Sept. 15, 2008: p. 7 Click on “OK” to “Text/Command Document” to create a file into which all your commands will go. William. E. Becker Module One, Part Two: Using LIMDEP Sept. 15, 2008: p. 8 The “read” command is typed or copied into the “Untitled” command file, with all subparts of a command separated with semicolons (;). The program is not case sensitive; thus, upper and lower case letters can be used interchangeably. The read command includes the number of variables or columns to be read (nvar= ), the number of records or observations for each variable (nobs= ), and the place to find the file (File= ). Because the names of the variables are on the first row of the file to be read, we tell this to LIMDEP with the Names=1 command. If the file path is long and involves spaces (as it is here, but your path will depend on where you placed your file), then quote marks are required around the path. The $ indicates the end of the command. Read;NVAR=7;NOBS=24;Names=1;File= "C:\Documents and Settings\beckerw\My Documents\WKPAPERS\NCEE - econometrics \Module One\post-pre.txt"$ William. E. Becker Module One, Part Two: Using LIMDEP Sept. 15, 2008: p. 9 Upon copying or typing this read command into the command file and highlighting the entire three lines, the screen display appears as below and the “Go” button is pressed to run the command. LIMDEP tells the user that it has attempted the command with the appearance of William. E. Becker Module One, Part Two: Using LIMDEP Sept. 15, 2008: p. 10 To check on the correct reading of the data, click the “Activate Data Editor” button, which is second from the right on the tool bar or go to Data Editor in the Window’s menu. Notice that if you use the Window’s menus, there are now four files open within Limdep: Untitled Project 1*, Untitled 1*, Output 1*, and Data Editor. As you already know, Untitled 1 contains your read command and Untitled Project is just information in the opening LIMDEP screen. Output contains the commands that LIMDEP has attempted, which so far only includes the read command. This output file could have also been accessed by clicking on the view square next to the X box in the following rectangle When it appeared to check on whether the read command was properly executed. William. E. Becker Module One, Part Two: Using LIMDEP Sept. 15, 2008: p. 11 READING LARGE FILES INTO LIMDEP LIMDEP has a data matrix default restriction of no more than 222 rows (records per variable), 900 columns (number of variables) and 200,000 cells. To read, import or create nonconforming data sets this default setting must be changed. For example, to accommodate larger data sets the number of rows must be increased. If the creation of more than 900 variables is anticipated, even if less than 900 variables were initially imported, then the number of columns must be increased before any data is read. This is accomplished by clicking the project button on the top ribbon, going to settings, and changing the number of cells and number of rows. As an example, consider the data set employed by Becker and Powers (2001), which initially had 2,837 records. Open LIMDEP and go to “Project” and then “Settings…,” which yields the following screen display: William. E. Becker Module One, Part Two: Using LIMDEP Sept. 15, 2008: p. 12 Increasing the “Number of Cells” from 200,000 to 2,000,000 and increasing “Rows” from 222 to 3,000, automatically resets the “Columns” to 666, which is more than sufficient to read the 64 variables in the initial data set and to accommodate any variables to be created within LIMDEP. Pressing “OK” resets the memory allocation that LIMDEP will employ for this data set. William. E. Becker Module One, Part Two: Using LIMDEP Sept. 15, 2008: p. 13 This Becker and Powers data set does not have variable names imbedded in it. Thus, they will be added to the read command. To now read the data follow the path “Files” to “New” to “Text/Command Document” and click “OK.” Entering the following read statement into the Text/Command file, highlighting it, and pushing the green “Go” button will enter the 2,837 records on 64 variables in file beck8WO into LIMDEP and each of the variables will be named as indicated by each two character label. READ; NREC=2837; NVAR=64; FILE=F:\beck8WO.csv; Names= A1,A2,X3, C,AL,AM,AN,CA,CB,CC,CH,CI,CJ,CK,CL,CM,CN,CO,CS,CT, CU,CV,CW,DB,DD,DI,DJ,DK,DL,DM,DN,DQ,DR,DS,DY,DZ,EA,EB,EE,EF, EI,EJ,EP,EQ,ER,ET,EY,EZ,FF,FN,FX,FY,FZ,GE,GH,GM,GN,GQ,GR,HB, HC,HD,HE,HF $ William. E. Becker Module One, Part Two: Using LIMDEP Sept. 15, 2008: p. 14 Defining all the variables is not critical for our purposes here, but the variables used in the Becker and Power’s study required the following definitions (where names are not upper- and lower-case sensitive): A1: Term, where 1= fall, 2 = spring A2: School code, where 100/199 = doctorate, 200/299 = comprehensive, 300/399 = lib arts, 400/499 = 2 year hb: initial class size (number taking preTUCE) hc: final class size (number taking postTUCE) dm: experiences measured by number of years teaching dj: teacher’s highest degree, where Bachelors=1, Masters=2, PhD=3 cc: postTUCE score (0 to 30) an: preTUCE score (0 to 30) ge: Student evaluation measured interest gh: Student evaluation measured textbook quality gm: Student evaluation measured regular instructor’s English ability gq: Student evaluation measured overall teaching effectiveness ci: Instructor sex (Male=1, Female=2) ck: English is native language of instructor (Yes=1, No=0) cs: PostTUCE score counts toward course grade (Yes=1, No=0) ff: GPA*100 fn: Student had high school economics (Yes=1, No=0) ey: Student’s sex (Male=1, Female=2) fx: Student working in a job (Yes=1, No=0) Notice that this data set is too large to fit in LIMDEP’s “Active Data Editor” but all of the data are there as verified with the following DSTAT command, which is entered in the Text/Command file and highlighted. Upon clicking on the Go button, the descriptive statistics for each variable appear in the output file. Again, the output file is accessed via the Window tab in the upper ribbon. (Notice that in this data set, all missing values were coded −9. ) Dstat; RHS= A1,A2,X3, C,AL,AM,AN,CA,CB,CC,CH,CI,CJ,CK,CL,CM,CN,CO,CS,CT, CU,CV,CW,DB,DD,DI,DJ,DK,DL,DM,DN,DQ,DR,DS,DY,DZ,EA,EB,EE,EF, EI,EJ,EP,EQ,ER,ET,EY,EZ,FF,FN,FX,FY,FZ,GE,GH,GM,GN,GQ,GR,HB, HC,HD,HE,HF $ William. E. Becker Module One, Part Two: Using LIMDEP Sept. 15, 2008: p. 15 William. E. Becker Module One, Part Two: Using LIMDEP Sept. 15, 2008: p. 16 In summary, the LIMDEP Help menu states that the READ command is of the general form READ ; Nobs = number of observations ; Nvar = number of variables ; Names = list of Nvar names ; File = name of the data file $ The default is an ASCII (or text) data file in which numbers are separated by blanks, tabs, and/or commas. Although not demonstrated here, LIMDEP will also read formatted files by adding the option “; Format = ( Fortran format )” to the read command. In addition, although not demonstrated, small data sets can be cut and pasted directly into the Test/Command Document, preceded by a simple read command “READ ; Nobs = number of observations; Nvar = number of variables$”, where “;Names = 1” would also be added if names appear on the line before the data. William. E. Becker Module One, Part Two: Using LIMDEP Sept. 15, 2008: p. 17 LEAST-SQUARES ESTIMATION AND LINEAR RESTRICTIONS IN LIMDEP To demonstrate some of the least-squares regression commands in LIMDEP, read either the Excel or space delineated text version of the 24 observations and 7 variable “post-pre” data set into LIMDEP. The model to be estimated is post 1 2 pre f (classes) All statistical and mathematical instructions must be placed in the “Text/Command Document” of LIMDEP, which is accessed via the “File” to “New” route described earlier: Once in the “Text/Command Document,” the command for a regression can be entered. Before doing this, however, recall that the posttest score is missing for the 24th person, as can be seen in the “Active Data Editor.” LIMDEP automatically codes all missing data that appear in a text or Excel file as “.” with the value −999. If a regression is estimated with the entire data set, William. E. Becker Module One, Part Two: Using LIMDEP Sept. 15, 2008: p. 18 then this fictitious −999 place holding value would be incorrectly employed. To avoid this, all commands can be prefaced with “skip,” which tells LIMDEP to not use records involving −999. (In the highly unlikely event that −999 is a legitimate value, then a recoding is required as discussed below.) The syntax for regressions in LIMDEP is Regress; lhs= ???; rhs=one, ??? $ where “lhs=” is the left-hand-side dependent variable and “rhs=” is the right-hand-side explanatory variable. The “one” is included on the right-hand-side to estimate a y-intercept. If this “one” is not specified then the regression is forced to go through the origin – that is, no constant term is estimated. Finally, LIMDEP will automatically predict the value of the dependent variable, including 95 percent confidence intervals, and show the results in the output file by adding “fill; list” to the regression command: Regress; lhs= ???; rhs=one, ???; fill; list $ To demonstrate some of the least-squares regression commands in LIMDEP read either the Excel or space delineated text version of the 24 observations and 7 variables “post-pre” data set into LIMDEP. The model to be estimated is post 1 2 pre 3class1 4class2 5class3 To avoid the sum of the four dummy variables equaling the column of ones in the data set, the fourth class is not included. The commands to be typed into the Untitled Text/Command Document are now skip$ Regress ; Lhs =post; Rhs =one, pre, class1, class2,class3; fill; list$ Highlighting these commands and pressing “Go” gives the results in the LIMDEP output file: William. E. Becker Module One, Part Two: Using LIMDEP Sept. 15, 2008: p. 19 William. E. Becker Module One, Part Two: Using LIMDEP Sept. 15, 2008: p. 20 Predicted Values (* => observation was not in estimating sample.) le One\post-pre.xls Observation Observed Y Predicted Y Residual 95% Forecast Interval 1 31.000 31.214 -.2138 28.3089 34.1187 2 30.000 29.697 .3034 26.7956 32.5975 3 33.000 32.731 .2690 29.8090 35.6530 4 31.000 31.214 -.2138 28.3089 34.1187 5 25.000 25.145 -.1449 22.1774 28.1124 6 32.000 34.005 -2.0048 31.0444 36.9653 7 32.000 32.488 -.4876 29.5784 35.3968 8 30.000 27.936 2.0640 25.1040 30.7679 9 31.000 30.970 .0296 28.1000 33.8408 10 23.000 23.384 -.3843 20.5091 26.2594 11 22.000 21.867 .1329 18.9513 24.7828 12 21.000 20.350 .6502 17.3811 23.3186 13 30.000 28.195 1.8046 25.3167 31.0740 14 21.000 20.609 .3907 17.6757 23.5428 15 19.000 19.092 -.0920 16.1089 22.0752 16 23.000 25.161 -2.1609 22.3001 28.0218 17 30.000 29.713 .2874 26.8053 32.6199 18 31.000 31.230 -.2298 28.2811 34.1786 19 20.000 19.172 .8276 16.2549 22.0900 20 26.000 23.724 2.2759 20.8105 26.6377 21 20.000 20.690 -.6897 17.7866 23.5927 22 14.000 16.138 -2.1380 13.1530 19.1230 23 28.000 28.276 -.2758 25.2500 31.3016 * 24 No data 14.621 No data 11.5836 17.6579 From this output the Predicted posttest score is 14.621, with 95 percent confidence interval equal to 11.5836< E(y|X24)< 17.6579. William. E. Becker Module One, Part Two: Using LIMDEP Sept. 15, 2008: p. 21 A researcher might be interested to test whether the class in which a student is enrolled affects his/her post-course test score, assuming fixed effects only. This linear restriction is done automatically in LIMDEP by adding the following “cls:” command to the regression statement in the Text/Command Document. Regress ; Lhs =post; Rhs =one, pre, class1, class2,class3; CLS: b(3)=0,b(4)=0,b(5)=0$ Upon highlighting and pressing the Go button, the following results will appear in the output file: --> Regress ; Lhs =post; Rhs =one, pre, class1, class2,class3; CLS: b(3)=0,b(... ************************************************************************ * NOTE: Deleted 1 observations with missing data. N is now 23 * ************************************************************************ le One\post-pre.xls +-----------------------------------------------------------------------+ | Ordinary least squares regression Weighting variable = none | | Dep. var. = POST Mean= 26.21739130 , S.D.= 5.384797808 | | Model size: Observations = 23, Parameters = 5, Deg.Fr.= 18 | | Residuals: Sum of squares= 28.59332986 , Std.Dev.= 1.26036 | | Fit: R-squared= .955177, Adjusted R-squared = .94522 | | Model test: F[ 4, 18] = 95.89, Prob value = .00000 | | Diagnostic: Log-L = -35.1389, Restricted(b=0) Log-L = -70.8467 | | LogAmemiyaPrCrt.= .660, Akaike Info. Crt.= 3.490 | | Autocorrel: Durbin-Watson Statistic = 1.72443, Rho = .13779 | +-----------------------------------------------------------------------+ +---------+--------------+----------------+--------+---------+----------+ |Variable | Coefficient | Standard Error |t-ratio |P[|T|>t] | Mean of X| +---------+--------------+----------------+--------+---------+----------+ Constant -3.585879292 1.6459223 -2.179 .0429 le One\post-pre.xl PRE 1.517221644 .93156695E-01 16.287 .0000 18.695652 CLASS1 1.420780437 .90500685 1.570 .1338 .21739130 CLASS2 1.177398543 .78819907 1.494 .1526 .30434783 CLASS3 2.954037461 .76623994 3.855 .0012 .26086957 (Note: E+nn or E-nn means multiply by 10 to + or -nn power.) le One\post-pre.xls le One\post-pre.xls +-----------------------------------------------------------------------+ | Linearly restricted regression | | Ordinary least squares regression Weighting variable = none | | Dep. var. = POST Mean= 26.21739130 , S.D.= 5.384797808 | | Model size: Observations = 23, Parameters = 2, Deg.Fr.= 21 | | Residuals: Sum of squares= 53.19669876 , Std.Dev.= 1.59160 | | Fit: R-squared= .916608, Adjusted R-squared = .91264 | | (Note: Not using OLS. R-squared is not bounded in [0,1] | | Model test: F[ 1, 21] = 230.82, Prob value = .00000 | | Diagnostic: Log-L = -42.2784, Restricted(b=0) Log-L = -70.8467 | | LogAmemiyaPrCrt.= 1.013, Akaike Info. Crt.= 3.850 | | Note, when restrictions are imposed, R-squared can be less than zero. | | F[ 3, 18] for the restrictions = 5.1627, Prob = .0095 | | Autocorrel: Durbin-Watson Statistic = 1.12383, Rho = .43808 | William. E. Becker Module One, Part Two: Using LIMDEP Sept. 15, 2008: p. 22 +-----------------------------------------------------------------------+ +---------+--------------+----------------+--------+---------+----------+ |Variable | Coefficient | Standard Error |t-ratio |P[|T|>t] | Mean of X| +---------+--------------+----------------+--------+---------+----------+ Constant -2.211829436 1.9004224 -1.164 .2597 le One\post-pre.xl PRE 1.520632737 .10008855 15.193 .0000 18.695652 CLASS1 .0000000000 ........(Fixed Parameter)........ .21739130 CLASS2 -.4440892099E-15........(Fixed Parameter)........ .30434783 CLASS3 -.4440892099E-15........(Fixed Parameter)........ .26086957 (Note: E+nn or E-nn means multiply by 10 to + or -nn power.) le One\post-pre.xls From the second part of this printout, the appropriate F to test Ho: β3 = β4 = β5 = 0 versus Ha: at least one Beta is nonzero is F[df1=3,df2=18] = 5.1627, with p-value = 0.0095. Thus, null hypothesis that none of the dummies is significant at 0.05 Type I error level can be rejected in favor of the hypothesis that at least one class is significant, assuming that the effect of pre-course test score on post-course test score is the same in all classes and only the constant is affected by class assignment. STRUCTURAL (CHOW) TEST The above test of the linear restriction β3 = β4 = β5 = 0 (no difference among classes), assumed that the pretest slope coefficient was constant, fixed and unaffected by the class to which a student belonged. A full structural test requires the fitting of four separate regressions to obtain the four residual sum of squares that are added to obtain the unrestricted sum of squares. The restricted sum of squares is obtained from a regression of posttest on pretest with no dummies for the classes; that is, the class to which a student belongs is irrelevant in the manner in which pretests determine the posttest score. The commands to be entered into the Document/text file of LIMDEP are as follows: Restricted Regression Sample; 1-23$ Regress ; Lhs =post; Rhs =one, pre$ Calc ; SSall = Sumsqdev$ Unrestricted Regressions Sample; 1-5$ Regress ; Lhs =post; Rhs =one, pre$ Calc ; SS1 = Sumsqdev$ William. E. Becker Module One, Part Two: Using LIMDEP Sept. 15, 2008: p. 23 Sample; 6-12$ Regress ; Lhs =post; Rhs =one, pre$ Calc ; SS2 = Sumsqdev$ Sample; 13-18$ Regress ; Lhs =post; Rhs =one, pre$ Calc ; SS3 = Sumsqdev$ Sample; 19-23$ Regress ; Lhs =post; Rhs =one, pre$ Calc ; SS4 = Sumsqdev$ Calc;List ;F=((SSall-(SS1+SS2+SS3+SS4))/3*2) / ((SS1+SS2+SS3+SS4)/(23-4*2))$ The LIMDEP output is --> --> --> --> RESET READ;FILE="C:\Documents and Settings\beckerw\My Documents\WKPAPERS\NCEE -... Reject; post=-999$ Regress ; Lhs =post; Rhs =one, pre, class1, class2,class3; CLS: b(3)=0,b(... +-----------------------------------------------------------------------+ | Ordinary least squares regression Weighting variable = none | | Dep. var. = POST Mean= 26.21739130 , S.D.= 5.384797808 | | Model size: Observations = 23, Parameters = 5, Deg.Fr.= 18 | | Residuals: Sum of squares= 28.59332986 , Std.Dev.= 1.26036 | | Fit: R-squared= .955177, Adjusted R-squared = .94522 | | Model test: F[ 4, 18] = 95.89, Prob value = .00000 | | Diagnostic: Log-L = -35.1389, Restricted(b=0) Log-L = -70.8467 | | LogAmemiyaPrCrt.= .660, Akaike Info. Crt.= 3.490 | | Autocorrel: Durbin-Watson Statistic = 1.72443, Rho = .13779 | +-----------------------------------------------------------------------+ +---------+--------------+----------------+--------+---------+----------+ |Variable | Coefficient | Standard Error |t-ratio |P[|T|>t] | Mean of X| +---------+--------------+----------------+--------+---------+----------+ Constant -3.585879292 1.6459223 -2.179 .0429 PRE 1.517221644 .93156695E-01 16.287 .0000 18.695652 CLASS1 1.420780437 .90500685 1.570 .1338 .21739130 CLASS2 1.177398543 .78819907 1.494 .1526 .30434783 CLASS3 2.954037461 .76623994 3.855 .0012 .26086957 (Note: E+nn or E-nn means multiply by 10 to + or -nn power.) +-----------------------------------------------------------------------+ | Linearly restricted regression | | Ordinary least squares regression Weighting variable = none | | Dep. var. = POST Mean= 26.21739130 , S.D.= 5.384797808 | | Model size: Observations = 23, Parameters = 2, Deg.Fr.= 21 | | Residuals: Sum of squares= 53.19669876 , Std.Dev.= 1.59160 | | Fit: R-squared= .916608, Adjusted R-squared = .91264 | | (Note: Not using OLS. R-squared is not bounded in [0,1] | | Model test: F[ 1, 21] = 230.82, Prob value = .00000 | | Diagnostic: Log-L = -42.2784, Restricted(b=0) Log-L = -70.8467 | | LogAmemiyaPrCrt.= 1.013, Akaike Info. Crt.= 3.850 | | Note, when restrictions are imposed, R-squared can be less than zero. | William. E. Becker Module One, Part Two: Using LIMDEP Sept. 15, 2008: p. 24 | F[ 3, 18] for the restrictions = 5.1627, Prob = .0095 | | Autocorrel: Durbin-Watson Statistic = 1.12383, Rho = .43808 | +-----------------------------------------------------------------------+ +---------+--------------+----------------+--------+---------+----------+ |Variable | Coefficient | Standard Error |t-ratio |P[|T|>t] | Mean of X| +---------+--------------+----------------+--------+---------+----------+ Constant -2.211829436 1.9004224 -1.164 .2597 PRE 1.520632737 .10008855 15.193 .0000 18.695652 CLASS1 .0000000000 ........(Fixed Parameter)........ .21739130 CLASS2 -.4440892099E-15........(Fixed Parameter)........ .30434783 CLASS3 -.4440892099E-15........(Fixed Parameter)........ .26086957 (Note: E+nn or E-nn means multiply by 10 to + or -nn power.) --> Sample; 1-23$ --> Regress ; Lhs =post; Rhs =one, pre$ +-----------------------------------------------------------------------+ | Ordinary least squares regression Weighting variable = none | | Dep. var. = POST Mean= 26.21739130 , S.D.= 5.384797808 | | Model size: Observations = 23, Parameters = 2, Deg.Fr.= 21 | | Residuals: Sum of squares= 53.19669876 , Std.Dev.= 1.59160 | | Fit: R-squared= .916608, Adjusted R-squared = .91264 | | Model test: F[ 1, 21] = 230.82, Prob value = .00000 | | Diagnostic: Log-L = -42.2784, Restricted(b=0) Log-L = -70.8467 | | LogAmemiyaPrCrt.= 1.013, Akaike Info. Crt.= 3.850 | | Autocorrel: Durbin-Watson Statistic = 1.12383, Rho = .43808 | +-----------------------------------------------------------------------+ +---------+--------------+----------------+--------+---------+----------+ |Variable | Coefficient | Standard Error |t-ratio |P[|T|>t] | Mean of X| +---------+--------------+----------------+--------+---------+----------+ Constant -2.211829436 1.9004224 -1.164 .2575 PRE 1.520632737 .10008855 15.193 .0000 18.695652 --> Calc ; SSall = Sumsqdev $ --> Sample; 1-5$ --> Regress ; Lhs =post; Rhs =one, pre$ +-----------------------------------------------------------------------+ | Ordinary least squares regression Weighting variable = none | | Dep. var. = POST Mean= 30.00000000 , S.D.= 3.000000000 | | Model size: Observations = 5, Parameters = 2, Deg.Fr.= 3 | | Residuals: Sum of squares= .2567567568 , Std.Dev.= .29255 | | Fit: R-squared= .992868, Adjusted R-squared = .99049 | | Model test: F[ 1, 3] = 417.63, Prob value = .00026 | | Diagnostic: Log-L = .3280, Restricted(b=0) Log-L = -12.0299 | | LogAmemiyaPrCrt.= -2.122, Akaike Info. Crt.= .669 | | Autocorrel: Durbin-Watson Statistic = 2.19772, Rho = -.09886 | +-----------------------------------------------------------------------+ +---------+--------------+----------------+--------+---------+----------+ |Variable | Coefficient | Standard Error |t-ratio |P[|T|>t] | Mean of X| +---------+--------------+----------------+--------+---------+----------+ Constant -2.945945946 1.6174496 -1.821 .1661 PRE 1.554054054 .76044788E-01 20.436 .0003 21.200000 (Note: E+nn or E-nn means multiply by 10 to + or -nn power.) --> Calc ; SS1 = Sumsqdev $ --> Sample; 6-12$ --> Regress ; Lhs =post; Rhs =one, pre$ +-----------------------------------------------------------------------+ William. E. Becker Module One, Part Two: Using LIMDEP Sept. 15, 2008: p. 25 | Ordinary least squares regression Weighting variable = none | | Dep. var. = POST Mean= 27.28571429 , S.D.= 5.023753103 | | Model size: Observations = 7, Parameters = 2, Deg.Fr.= 5 | | Residuals: Sum of squares= 7.237132353 , Std.Dev.= 1.20309 | | Fit: R-squared= .952208, Adjusted R-squared = .94265 | | Model test: F[ 1, 5] = 99.62, Prob value = .00017 | | Diagnostic: Log-L = -10.0492, Restricted(b=0) Log-L = -20.6923 | | LogAmemiyaPrCrt.= .621, Akaike Info. Crt.= 3.443 | | Autocorrel: Durbin-Watson Statistic = 1.50037, Rho = .24982 | +-----------------------------------------------------------------------+ +---------+--------------+----------------+--------+---------+----------+ |Variable | Coefficient | Standard Error |t-ratio |P[|T|>t] | Mean of X| +---------+--------------+----------------+--------+---------+----------+ Constant .6268382353 2.7094095 .231 .8262 PRE 1.362132353 .13647334 9.981 .0002 19.571429 --> Calc ; SS2 = Sumsqdev $ --> Sample; 13-18$ --> Regress ; Lhs =post; Rhs =one, pre$ +-----------------------------------------------------------------------+ | Ordinary least squares regression Weighting variable = none | | Dep. var. = POST Mean= 25.66666667 , S.D.= 5.278888772 | | Model size: Observations = 6, Parameters = 2, Deg.Fr.= 4 | | Residuals: Sum of squares= 8.081250000 , Std.Dev.= 1.42138 | | Fit: R-squared= .942001, Adjusted R-squared = .92750 | | Model test: F[ 1, 4] = 64.97, Prob value = .00129 | | Diagnostic: Log-L = -9.4070, Restricted(b=0) Log-L = -17.9490 | | LogAmemiyaPrCrt.= .991, Akaike Info. Crt.= 3.802 | | Autocorrel: Durbin-Watson Statistic = 1.51997, Rho = .24001 | +-----------------------------------------------------------------------+ +---------+--------------+----------------+--------+---------+----------+ |Variable | Coefficient | Standard Error |t-ratio |P[|T|>t] | Mean of X| +---------+--------------+----------------+--------+---------+----------+ Constant -1.525000000 3.4231291 -.445 .6790 PRE 1.568750000 .19463006 8.060 .0013 17.333333 --> Calc ; SS3 = Sumsqdev $ --> Sample; 19-23$ --> Regress ; Lhs =post; Rhs =one, pre$ +-----------------------------------------------------------------------+ | Ordinary least squares regression Weighting variable = none | | Dep. var. = POST Mean= 21.60000000 , S.D.= 5.549774770 | | Model size: Observations = 5, Parameters = 2, Deg.Fr.= 3 | | Residuals: Sum of squares= 8.924731183 , Std.Dev.= 1.72479 | | Fit: R-squared= .927559, Adjusted R-squared = .90341 | | Model test: F[ 1, 3] = 38.41, Prob value = .00846 | | Diagnostic: Log-L = -8.5432, Restricted(b=0) Log-L = -15.1056 | | LogAmemiyaPrCrt.= 1.427, Akaike Info. Crt.= 4.217 | | Autocorrel: Durbin-Watson Statistic = .82070, Rho = .58965 | +-----------------------------------------------------------------------+ +---------+--------------+----------------+--------+---------+----------+ |Variable | Coefficient | Standard Error |t-ratio |P[|T|>t] | Mean of X| +---------+--------------+----------------+--------+---------+----------+ Constant -7.494623656 4.7572798 -1.575 .2132 PRE 1.752688172 .28279093 6.198 .0085 16.600000 --> Calc ; SS4 = Sumsqdev $ --> Calc;List ;F=((SSall-(SS1+SS2+SS3+SS4))/(3*2)) / ((SS1+SS2+SS3+SS4)/(23-4*2))$ William. E. Becker Module One, Part Two: Using LIMDEP Sept. 15, 2008: p. 26 F = .29282633057790450D+01 The structural test across all classes is H0 : β1 β2 . . . β4 and H a : β ' s are not equal F (Re sSSr Re sSSu ) / 2( J 1K ) Re sSSu /(n JK ) Because the calculated F = 2.92, and the critical F (Prob of Type I error =0.05, df1=6, df2=15) = 2.79, we reject the null hypothesis and conclude that at least one class is significantly different from another, allowing the slope on pre-course test score to vary from one class to another. That is, the class in which a student is enrolled is important because of a change in slope and/or the intercept. HETEROSCEDASTICITY To adjust for either heteroscedasticity across individual observations or a common error term within groups but not across groups the “hetro” and “cluster” command can be added to the standard “regress” command in LIMDEP in the following manner: Skip Regress; Lhs= post; Rhs= one, pre, class1, class2, class3$ Regress; Lhs= post; Rhs= one, pre, class1, class2, class3 ;hetro $ Create; Class = class1+2*class2+3*class3+4*class4$ Regress ; Lhs= post; Rhs= one, pre, class1, class2, class3 ;cluster=class $ where the “class” variable is created to name the classes 1, 2, 3 and 4 to enable their identification in the “cluster” command. The resulting LIMDEP output shows a marked increase in the significance of the individual group effects, as reflected in their respective p-values. --> RESET --> READ;FILE="C:\Documents and Settings\beckerw\My Documents\WKPAPERS\NCEE -... --> skip William. E. Becker Module One, Part Two: Using LIMDEP Sept. 15, 2008: p. 27 --> Regress; Lhs= post; Rhs= one, pre, class1, class2, class3$ ************************************************************************ * NOTE: Deleted 1 observations with missing data. N is now 23 * ************************************************************************ le One\post-pre.xls +-----------------------------------------------------------------------+ | Ordinary least squares regression Weighting variable = none | | Dep. var. = POST Mean= 26.21739130 , S.D.= 5.384797808 | | Model size: Observations = 23, Parameters = 5, Deg.Fr.= 18 | | Residuals: Sum of squares= 28.59332986 , Std.Dev.= 1.26036 | | Fit: R-squared= .955177, Adjusted R-squared = .94522 | | Model test: F[ 4, 18] = 95.89, Prob value = .00000 | | Diagnostic: Log-L = -35.1389, Restricted(b=0) Log-L = -70.8467 | | LogAmemiyaPrCrt.= .660, Akaike Info. Crt.= 3.490 | | Autocorrel: Durbin-Watson Statistic = 1.72443, Rho = .13779 | +-----------------------------------------------------------------------+ +---------+--------------+----------------+--------+---------+----------+ |Variable | Coefficient | Standard Error |t-ratio |P[|T|>t] | Mean of X| +---------+--------------+----------------+--------+---------+----------+ Constant -3.585879292 1.6459223 -2.179 .0429 le One\post-pre.xl PRE 1.517221644 .93156695E-01 16.287 .0000 18.695652 CLASS1 1.420780437 .90500685 1.570 .1338 .21739130 CLASS2 1.177398543 .78819907 1.494 .1526 .30434783 CLASS3 2.954037461 .76623994 3.855 .0012 .26086957 (Note: E+nn or E-nn means multiply by 10 to + or -nn power.) le One\post-pre.xls --> Regress; Lhs= post; Rhs= one, pre, class1, class2, class3 ;hetro $ ************************************************************************ * NOTE: Deleted 1 observations with missing data. N is now 23 * ************************************************************************ le One\post-pre.xls +-----------------------------------------------------------------------+ | Ordinary least squares regression Weighting variable = none | | Dep. var. = POST Mean= 26.21739130 , S.D.= 5.384797808 | | Model size: Observations = 23, Parameters = 5, Deg.Fr.= 18 | | Residuals: Sum of squares= 28.59332986 , Std.Dev.= 1.26036 | | Fit: R-squared= .955177, Adjusted R-squared = .94522 | | Model test: F[ 4, 18] = 95.89, Prob value = .00000 | | Diagnostic: Log-L = -35.1389, Restricted(b=0) Log-L = -70.8467 | | LogAmemiyaPrCrt.= .660, Akaike Info. Crt.= 3.490 | | Autocorrel: Durbin-Watson Statistic = 1.72443, Rho = .13779 | | Results Corrected for heteroskedasticity | | Breusch - Pagan chi-squared = 4.0352, with 4 degrees of freedom | +-----------------------------------------------------------------------+ +---------+--------------+----------------+--------+---------+----------+ |Variable | Coefficient | Standard Error |t-ratio |P[|T|>t] | Mean of X| +---------+--------------+----------------+--------+---------+----------+ Constant -3.585879292 1.5096560 -2.375 .0289 le One\post-pre.xl PRE 1.517221644 .72981808E-01 20.789 .0000 18.695652 CLASS1 1.420780437 .67752835 2.097 .0504 .21739130 William. E. Becker Module One, Part Two: Using LIMDEP Sept. 15, 2008: p. 28 CLASS2 1.177398543 .72249740 1.630 .1206 CLASS3 2.954037461 .80582075 3.666 .0018 (Note: E+nn or E-nn means multiply by 10 to + or -nn power.) le One\post-pre.xls .30434783 .26086957 --> Create; Class = class1+2*class2+3*class3+4*class4$ --> Regress ; Lhs= post; Rhs= one, pre, class1, class2, class3 ;cluster=class $ ************************************************************************ * NOTE: Deleted 1 observations with missing data. N is now 23 * ************************************************************************ le One\post-pre.xls +-----------------------------------------------------------------------+ | Ordinary least squares regression Weighting variable = none | | Dep. var. = POST Mean= 26.21739130 , S.D.= 5.384797808 | | Model size: Observations = 23, Parameters = 5, Deg.Fr.= 18 | | Residuals: Sum of squares= 28.59332986 , Std.Dev.= 1.26036 | | Fit: R-squared= .955177, Adjusted R-squared = .94522 | | Model test: F[ 4, 18] = 95.89, Prob value = .00000 | | Diagnostic: Log-L = -35.1389, Restricted(b=0) Log-L = -70.8467 | | LogAmemiyaPrCrt.= .660, Akaike Info. Crt.= 3.490 | | Autocorrel: Durbin-Watson Statistic = 1.72443, Rho = .13779 | +-----------------------------------------------------------------------+ +-----------------------------------------------------------------------+ | Covariance matrix for the model is adjusted for data clustering. | | Sample of 23 observations contained 4 clusters defined by | | variable CLASS which identifies by a value a cluster ID. | +---------+--------------+----------------+--------+---------+----------+ |Variable | Coefficient | Standard Error |t-ratio |P[|T|>t] | Mean of X| +---------+--------------+----------------+--------+---------+----------+ Constant -3.585879292 1.5875538 -2.259 .0365 le One\post-pre.xl PRE 1.517221644 .95635769E-01 15.865 .0000 18.695652 CLASS1 1.420780437 .43992454 3.230 .0046 .21739130 CLASS2 1.177398543 .28417486 4.143 .0006 .30434783 CLASS3 2.954037461 .70132897E-01 42.121 .0000 .26086957 (Note: E+nn or E-nn means multiply by 10 to + or -nn power.) le One\post-pre.xls ESTIMATING PROBIT MODELS IN LIMDEP Often variables need to be transformed or created within a computer program to perform the desired analysis. To demonstrate the process and commands in LIMDEP, start with the Becker and Power’s data that have been or can be read into LIMDEP as shown earlier. After reading the data into LIMDEP the first task is to recode the qualitative data into appropriate dummies. A2 contains a range of values representing various classes of institutions. These are recoded via the “recode” command, where A2 is set equal to 1 for doctoral institutions (100/199), 2 for comprehensive or master’s degree granting institutions (200/299), 3 for liberal arts colleges William. E. Becker Module One, Part Two: Using LIMDEP Sept. 15, 2008: p. 29 (300/399) and 4 for two-year colleges (400/499) . The “create” command is then used to create 1 and 0 bivariate variables for each of these institutions of post-secondary education: recode; a2; 100/199 = 1; 200/299 = 2; 300/399 = 3; 400/499 =4$ create; doc=a2=1; comp=a2=2; lib=a2=3; twoyr=a2=4$ As should be apparent, this syntax says if a2 has a value between 100 and 199 recode it to be 1. If a2 has a value between 200 and 299 recode it to be 2 and so on. Next, create a variable called “doc” and if a2=1, then set doc=1 and for any other value of a2 let doc=0. Create a variable called “comp” and if a2=2, then set comp=1 and for any other value of a2 let comp=0, and so on. Next 1 - 0 bivariates are created to show whether the instructor had a PhD degree and where the student got a positive score on the postTUCE: create; phd=dj=3; final=cc>0$ To allow for quadratic forms in teacher experiences and class size the following variables are created: create; dmsq=dm^2; hbsq=hb^2$ In this data set, as can be seen in the descriptive statistics (DSTAT), all missing values were coded −9. Thus, adding together some of the responses to the student evaluations gives information on whether a student actually completed an evaluation. For example, if the sum of ge, gh, gm, and gq equals −36, we know that the student did not complete a student evaluation in a meaningful way. A dummy variable to reflect this fact is then created by: create; evalsum=ge+gh+gm+gq; noeval=evalsum=−36$ Finally, from the TUCE developer it is known that student number 2216 was counted in term 2 but was in term 1 but no postTUCE was taken. This error is corrected with the following command: recode; hb; 90=89$ #2216 counted in term 2, but in term 1 with no posttest These “create” and “recode” commands can be entered into LIMDEP as a block, highlighted and run with the “Go” button. Notice, also, that descriptive statements can be written after the “$” as a reminder or for later justification or reference as to why the command was included. William. E. Becker Module One, Part Two: Using LIMDEP Sept. 15, 2008: p. 30 One of the things of interest to Becker and Powers was whether class size at the beginning or end of the term influenced whether a student completed the postTUCE. This can be assessed by fitting a probit model to the 1 – 0 discrete dependent variable “final.” To do this, however, we must make sure that there are no missing data on the variables to be included as regressors. In this data set, all missing values were coded −9. LIMDEP’s “reject” command can be employed to remove all records with a −9 value. The “probit” command is used to invoke a maximum likelihood estimation with the following syntax: Probit; Lhs=???; rhs=one, ???; marginaleffect$ where the addition of the “marginaleffect” tells LIMDEP to calculate marginal effects regardless of whether the explanatory variable is or is not continuous. The commands to be entered into the Text/Command Document are then Reject; AN=-9$ Reject; HB=-9$ Reject; ci=-9$ Reject; ck=-9$ William. E. Becker Module One, Part Two: Using LIMDEP Sept. 15, 2008: p. 31 Reject; cs=0$ Reject; cs=-9$ Reject; a2=-9$ Reject; phd=-9$ reject; hc=-9$ probit;lhs=final; rhs=one,an,hb,doc,comp,lib,ci,ck,phd,noeval;marginaleffect$ probit;lhs=final; rhs=one,an,hc,doc,comp,lib,ci,ck,phd,noeval;marginaleffect$ which upon highlighting and pressing the Go button yields the output for these two probit models. --> probit;lhs=final; rhs=one,an,hb,doc,comp,lib,ci,ck,phd,noeval;marginaleffect$ Normal exit from iterations. Exit status=0. +---------------------------------------------+ William. E. Becker Module One, Part Two: Using LIMDEP Sept. 15, 2008: p. 32 | Binomial Probit Model | | Maximum Likelihood Estimates | | Model estimated: May 05, 2008 at 04:07:02PM.| | Dependent variable FINAL | | Weighting variable None | | Number of observations 2587 | | Iterations completed 6 | | Log likelihood function -822.7411 | | Restricted log likelihood -1284.216 | | Chi squared 922.9501 | | Degrees of freedom 9 | | Prob[ChiSqd > value] = .0000000 | | Hosmer-Lemeshow chi-squared = 26.06658 | | P-value= .00102 with deg.fr. = 8 | +---------------------------------------------+ +---------+--------------+----------------+--------+---------+----------+ |Variable | Coefficient | Standard Error |b/St.Er.|P[|Z|>z] | Mean of X| +---------+--------------+----------------+--------+---------+----------+ Index function for probability Constant .9953497702 .24326247 4.092 .0000 AN .2203899720E-01 .94751772E-02 2.326 .0200 10.596830 HB -.4882560519E-02 .19241005E-02 -2.538 .0112 55.558949 DOC .9757147902 .14636173 6.666 .0000 .31774256 COMP .4064945318 .13926507 2.919 .0035 .41785852 LIB .5214436028 .17664590 2.952 .0032 .13567839 CI .1987315042 .91686501E-01 2.168 .0302 1.2311558 CK .8778999306E-01 .13428742 .654 .5133 .91998454 PHD -.1335050091 .10303166 -1.296 .1951 .68612292 NOEVAL -1.930522400 .72391102E-01 -26.668 .0000 .29068419 (Note: E+nn or E-nn means multiply by 10 to + or -nn power.) +-------------------------------------------+ | Partial derivatives of E[y] = F[*] with | | respect to the vector of characteristics. | | They are computed at the means of the Xs. | | Observations used for means are All Obs. | +-------------------------------------------+ +---------+--------------+----------------+--------+---------+----------+ |Variable | Coefficient | Standard Error |b/St.Er.|P[|Z|>z] | Mean of X| +---------+--------------+----------------+--------+---------+----------+ Index function for probability Constant .1977242134 .48193408E-01 4.103 .0000 AN .4378002101E-02 .18769275E-02 2.333 .0197 10.596830 HB -.9699107460E-03 .38243741E-03 -2.536 .0112 55.558949 Marginal effect for dummy variable is P|1 - P|0. DOC .1595047130 .20392136E-01 7.822 .0000 .31774256 Marginal effect for dummy variable is P|1 - P|0. COMP .7783344522E-01 .25881201E-01 3.007 .0026 .41785852 Marginal effect for dummy variable is P|1 - P|0. LIB .8208261358E-01 .21451464E-01 3.826 .0001 .13567839 CI .3947761030E-01 .18186048E-01 2.171 .0299 1.2311558 Marginal effect for dummy variable is P|1 - P|0. CK .1820482750E-01 .29016989E-01 .627 .5304 .91998454 Marginal effect for dummy variable is P|1 - P|0. PHD -.2575430653E-01 .19325466E-01 -1.333 .1826 .68612292 Marginal effect for dummy variable is P|1 - P|0. William. E. Becker Module One, Part Two: Using LIMDEP Sept. 15, 2008: p. 33 NOEVAL -.5339850032 .19586185E-01 -27.263 .0000 (Note: E+nn or E-nn means multiply by 10 to + or -nn power.) .29068419 +----------------------------------------+ | Fit Measures for Binomial Choice Model | | Probit model for variable FINAL | +----------------------------------------+ | Proportions P0= .197140 P1= .802860 | | N = 2587 N0= 510 N1= 2077 | | LogL = -822.74107 LogL0 = -1284.2161 | | Estrella = 1-(L/L0)^(-2L0/n) = .35729 | +----------------------------------------+ | Efron | McFadden | Ben./Lerman | | .39635 | .35934 | .80562 | | Cramer | Veall/Zim. | Rsqrd_ML | | .38789 | .52781 | .30006 | +----------------------------------------+ | Information Akaike I.C. Schwarz I.C. | | Criteria .64379 1724.06468 | +----------------------------------------+ Frequencies of actual & predicted outcomes Predicted outcome has maximum probability. Threshold value for predicting Y=1 = .5000 Predicted ------ ---------- + ----Actual 0 1 | Total ------ ---------- + ----0 342 168 | 510 1 197 1880 | 2077 ------ ---------- + ----Total 539 2048 | 2587 --> probit;lhs=final; rhs=one,an,hc,doc,comp,lib,ci,ck,phd,noeval;marginaleffect$ Normal exit from iterations. Exit status=0. +---------------------------------------------+ | Binomial Probit Model | | Maximum Likelihood Estimates | | Model estimated: May 05, 2008 at 04:07:03PM.| | Dependent variable FINAL | | Weighting variable None | | Number of observations 2587 | | Iterations completed 6 | | Log likelihood function -825.9472 | | Restricted log likelihood -1284.216 | | Chi squared 916.5379 | | Degrees of freedom 9 | | Prob[ChiSqd > value] = .0000000 | | Hosmer-Lemeshow chi-squared = 22.57308 | | P-value= .00396 with deg.fr. = 8 | +---------------------------------------------+ +---------+--------------+----------------+--------+---------+----------+ |Variable | Coefficient | Standard Error |b/St.Er.|P[|Z|>z] | Mean of X| +---------+--------------+----------------+--------+---------+----------+ Index function for probability Constant .8712666323 .24117408 3.613 .0003 William. E. Becker Module One, Part Two: Using LIMDEP Sept. 15, 2008: p. 34 AN .2259549490E-01 .94553383E-02 2.390 .0169 HC .1585898886E-03 .21039762E-02 .075 .9399 DOC .8804040395 .14866411 5.922 .0000 COMP .4596088640 .13798168 3.331 .0009 LIB .5585267697 .17568141 3.179 .0015 CI .1797199200 .90808055E-01 1.979 .0478 CK .1415663447E-01 .13332671 .106 .9154 PHD -.2351326125 .10107423 -2.326 .0200 NOEVAL -1.928215642 .72363621E-01 -26.646 .0000 (Note: E+nn or E-nn means multiply by 10 to + or -nn power.) 10.596830 49.974874 .31774256 .41785852 .13567839 1.2311558 .91998454 .68612292 .29068419 +-------------------------------------------+ | Partial derivatives of E[y] = F[*] with | | respect to the vector of characteristics. | | They are computed at the means of the Xs. | | Observations used for means are All Obs. | +-------------------------------------------+ +---------+--------------+----------------+--------+---------+----------+ |Variable | Coefficient | Standard Error |b/St.Er.|P[|Z|>z] | Mean of X| +---------+--------------+----------------+--------+---------+----------+ Index function for probability Constant .1735365132 .47945637E-01 3.619 .0003 AN .4500509092E-02 .18776909E-02 2.397 .0165 10.596830 HC .3158750180E-04 .41902052E-03 .075 .9399 49.974874 Marginal effect for dummy variable is P|1 - P|0. DOC .1467543687 .21319420E-01 6.884 .0000 .31774256 Marginal effect for dummy variable is P|1 - P|0. COMP .8785901674E-01 .25536388E-01 3.441 .0006 .41785852 Marginal effect for dummy variable is P|1 - P|0. LIB .8672357482E-01 .20661637E-01 4.197 .0000 .13567839 CI .3579612385E-01 .18068050E-01 1.981 .0476 1.2311558 Marginal effect for dummy variable is P|1 - P|0. CK .2839467767E-02 .26927626E-01 .105 .9160 .91998454 Marginal effect for dummy variable is P|1 - P|0. PHD -.4448632109E-01 .18193388E-01 -2.445 .0145 .68612292 Marginal effect for dummy variable is P|1 - P|0. NOEVAL -.5339710749 .19569243E-01 -27.286 .0000 .29068419 (Note: E+nn or E-nn means multiply by 10 to + or -nn power.) +----------------------------------------+ | Fit Measures for Binomial Choice Model | | Probit model for variable FINAL | +----------------------------------------+ | Proportions P0= .197140 P1= .802860 | | N = 2587 N0= 510 N1= 2077 | | LogL = -825.94717 LogL0 = -1284.2161 | | Estrella = 1-(L/L0)^(-2L0/n) = .35481 | +----------------------------------------+ | Efron | McFadden | Ben./Lerman | | .39186 | .35685 | .80450 | | Cramer | Veall/Zim. | Rsqrd_ML | | .38436 | .52510 | .29833 | +----------------------------------------+ | Information Akaike I.C. Schwarz I.C. | | Criteria .64627 1730.47688 | +----------------------------------------+ William. E. Becker Module One, Part Two: Using LIMDEP Sept. 15, 2008: p. 35 Frequencies of actual & predicted outcomes Predicted outcome has maximum probability. Threshold value for predicting Y=1 = .5000 Predicted ------ ---------- + ----Actual 0 1 | Total ------ ---------- + ----0 337 173 | 510 1 192 1885 | 2077 ------ ---------- + ----Total 529 2058 | 2587 For each of these two probits, the first block of coefficients are for the latent variable probit equation. The second block provides the marginal effects. The initial class size (hb) probit coefficient −0.004883, however, is highly significant with a two-tail p-value of 0.0112. On the other hand, the end-of-term class size (hc) probit coefficient (0.000159) is insignificant with a two-tail p-value of 0.9399. The overall goodness of fit can be assessed in several ways. The easiest is the proportion of correct 0 and 1 predictions: For the first probit, using initial class size (hb) as an explanatory variable, the proportion of correct prediction is 0.859 = (342+1880)/2587. For the second probit, using end-of-term class size (hc) as an explanatory variable, the proportion of correct prediction is also 0.859 = (337+1885)/2587. The Chi-square (922.95, df =9) for the probit employing the initial class size is slightly higher than that for the end-of-term probit (916.5379, df =9) but they are both highly significant. Finally, worth noting when using the “reject” command is that the record is not removed. It can be reactivated with the “include” command. Active and inactive status can be observed in LIMDEP’s editor by the presence or lack of presence of chevrons (>>) next to the row number down the left-hand side of the display. If you wish to save you work in LIMDEP you must make sure to save each of the files you want separately. Your Text/Command Document, data file, and output files must be saved individually in LIMDEP. There is no global saving of all three files. CONCLUDING REMARKS The goal of this hands-on component of this first of four modules was to enable users to get data into LIMDEP, create variables and run regressions on continuous and discrete variables; it was not to explain all of the statistics produced by computer output. For this an intermediate level econometrics textbook (such as Jeffrey Wooldridge, Introductory Econometrics) or advanced econometrics textbook such as (William Greene, Econometric Analysis) must be consulted. William. E. Becker Module One, Part Two: Using LIMDEP Sept. 15, 2008: p. 36 REFERENCES Becker, William E. and John Powers (2001). “Student Performance, Attrition, and Class Size Given Missing Student Data,” Economics of Education Review, Vol. 20, August: 377-388. Hilbe, Joseph M. (2006). “A Review of LIMDEP 9.0 and NLOGIT 4.0.” The American Statistician, 60(May): 187-202. William. E. Becker Module One, Part Two: Using LIMDEP Sept. 15, 2008: p. 37
