Lab Quiz 1
advertisement
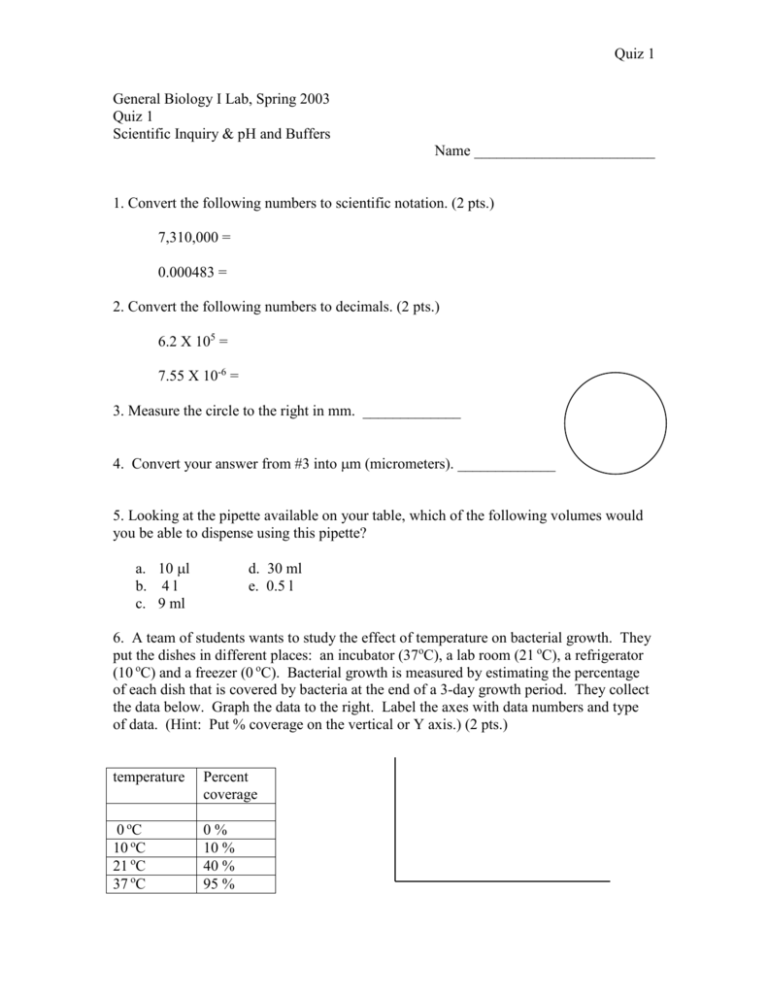
Quiz 1 General Biology I Lab, Spring 2003 Quiz 1 Scientific Inquiry & pH and Buffers Name ________________________ 1. Convert the following numbers to scientific notation. (2 pts.) 7,310,000 = 0.000483 = 2. Convert the following numbers to decimals. (2 pts.) 6.2 X 105 = 7.55 X 10-6 = 3. Measure the circle to the right in mm. _____________ 4. Convert your answer from #3 into m (micrometers). _____________ 5. Looking at the pipette available on your table, which of the following volumes would you be able to dispense using this pipette? a. 10 l b. 4 l c. 9 ml d. 30 ml e. 0.5 l 6. A team of students wants to study the effect of temperature on bacterial growth. They put the dishes in different places: an incubator (37oC), a lab room (21 oC), a refrigerator (10 oC) and a freezer (0 oC). Bacterial growth is measured by estimating the percentage of each dish that is covered by bacteria at the end of a 3-day growth period. They collect the data below. Graph the data to the right. Label the axes with data numbers and type of data. (Hint: Put % coverage on the vertical or Y axis.) (2 pts.) temperature Percent coverage 0 oC 10 oC 21 oC 37 oC 0% 10 % 40 % 95 % Quiz 1 7. Given the graph you made in number 6, what conclusion can you make about bacterial growth with respect to temperature? 8. Assume that the hydrogen ion concentration of a solution is equal to 10-4 molar, what is the pH of this solution? 9. If the pH of a solution is 7, what is the concentration of hydroxide ions [OH-]? 10. You measure the pH of your garden soil and find that it is 6. You measure the pH of peat moss and find that it is 4. How much greater is the concentration of hydrogen ions in peat moss than in the garden soil? (2 pts.) 11. Aspirin has a pH of 3. Some people who take large amounts of aspirin (for example, for arthritis) take a pill that combines aspirin with Maalox. What’s the purpose of this combination? (2 pts.) 12. Draw a hypothetical graph of pH versus drops of acid added to water. Be sure to put a title and axis-labels on your graph. (2 pts.) 13. Draw a hypothetical graph of pH versus drops of acid added for a solution buffered at a pH of 7. Be sure to put a title and axis-labels on your graph. (2 pts.)
