Newton's 2nd Law
advertisement
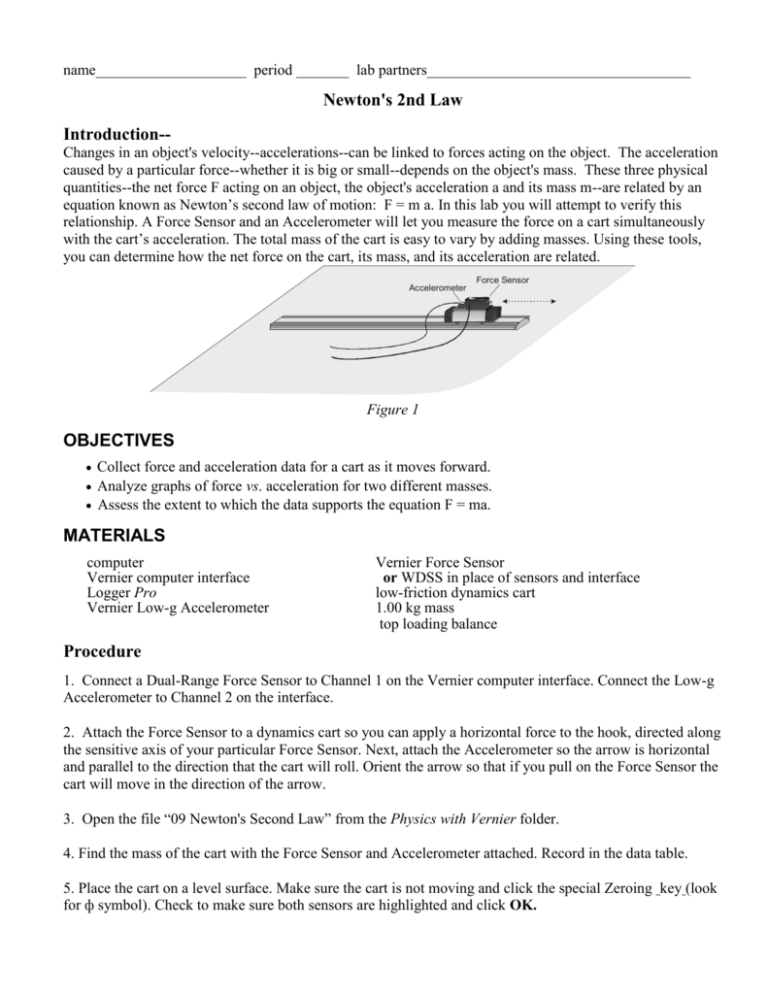
name____________________ period _______ lab partners___________________________________ Newton's 2nd Law Introduction-Changes in an object's velocity--accelerations--can be linked to forces acting on the object. The acceleration caused by a particular force--whether it is big or small--depends on the object's mass. These three physical quantities--the net force F acting on an object, the object's acceleration a and its mass m--are related by an equation known as Newton’s second law of motion: F = m a. In this lab you will attempt to verify this relationship. A Force Sensor and an Accelerometer will let you measure the force on a cart simultaneously with the cart’s acceleration. The total mass of the cart is easy to vary by adding masses. Using these tools, you can determine how the net force on the cart, its mass, and its acceleration are related. Accelerometer Force Sensor Figure 1 OBJECTIVES Collect force and acceleration data for a cart as it moves forward. Analyze graphs of force vs. acceleration for two different masses. Assess the extent to which the data supports the equation F = ma. MATERIALS computer Vernier computer interface Logger Pro Vernier Low-g Accelerometer Vernier Force Sensor or WDSS in place of sensors and interface low-friction dynamics cart 1.00 kg mass top loading balance Procedure 1. Connect a Dual-Range Force Sensor to Channel 1 on the Vernier computer interface. Connect the Low-g Accelerometer to Channel 2 on the interface. 2. Attach the Force Sensor to a dynamics cart so you can apply a horizontal force to the hook, directed along the sensitive axis of your particular Force Sensor. Next, attach the Accelerometer so the arrow is horizontal and parallel to the direction that the cart will roll. Orient the arrow so that if you pull on the Force Sensor the cart will move in the direction of the arrow. 3. Open the file “09 Newton's Second Law” from the Physics with Vernier folder. 4. Find the mass of the cart with the Force Sensor and Accelerometer attached. Record in the data table. 5. Place the cart on a level surface. Make sure the cart is not moving and click the special Zeroing key (look for ф symbol). Check to make sure both sensors are highlighted and click OK. A. Trials With Lesser Mass (Mass of Cart, etc. Only) 6. You are now ready to collect force and acceleration data. Connect the spring scale provided to the Force Sensor hook. Grasp the other end of the spring scale (a loose chain) and be ready to pull it to move the cart forward. For this first trial plan on pulling gently on the chain so that the spring scale reads a maximum amount of one unit (your instructor will specify that unit). Click collect and pull to move the cart steadily forward taking data for a few seconds until you run out of room and the cart's motion must stop. 7. Examine the resulting Force vs. Time graph. You basically want to pick a region (a time interval of 0.5 to 1.5 seconds) where the force is both relatively large and not wildly varying. Click the STAT key, use your mouse to highlight the region of interest, click STAT again (as needed) to display a box that most notably displays a "Mean Force" value for the time interval of interest. Click on the Acceleration vs. Time graph below and highlight / use STAT to get similar information for the "Mean Acceleration" during this same time interval. (Right click, select delete STAT box and right click graph itself to delete the highlighted region.) Record values for mean force and mean acceleration in Data Table A. 8. Record steps 6. and 7. above with a slightly greater value of force applied with each increasing trial. Go from the one unit of force (as read on the spring scale) initially used to two, then three, then four, then five units of force. The goal is to get five roughly equally spaced data points. B. Trials With Greater Mass (Mass of Cart, etc. plus 1.00 kg) 9. Add a 1.00 kg mass to the cart. Record the mass of the cart, sensors, and this added mass in the data table. 10. Repeat Steps 6—8. Data Table A Trial # mass = __________ Force (Newtons) Acceleration (m / sec2) Data Table B Trial # 1 1 2 2 3 3 4 4 5 5 mass = __________ Force (Newtons) Acceleration (m / sec2) Data Handling / Questions 1. On the same sheet of graph paper: (Consider plotting points for a) and b) below in different colors) a) Using data in Data Table A, plot acceleration a (in m / sec2 plotted vertically) vs. force F (plotted horizontally). Draw a best fit line through the data points and determine the slope. Show your work here. b) Using data in Data Table B, plot acceleration a (in m / sec2 plotted vertically) vs. force F (plotted horizontally). Draw a best fit line through the data points and determine the slope. Show your work here. 2. Compare the slope from each graph with the slope expected from F = ma by computing percent error.
