Newton's Second Law Lab - Ridgefield Public Schools
advertisement
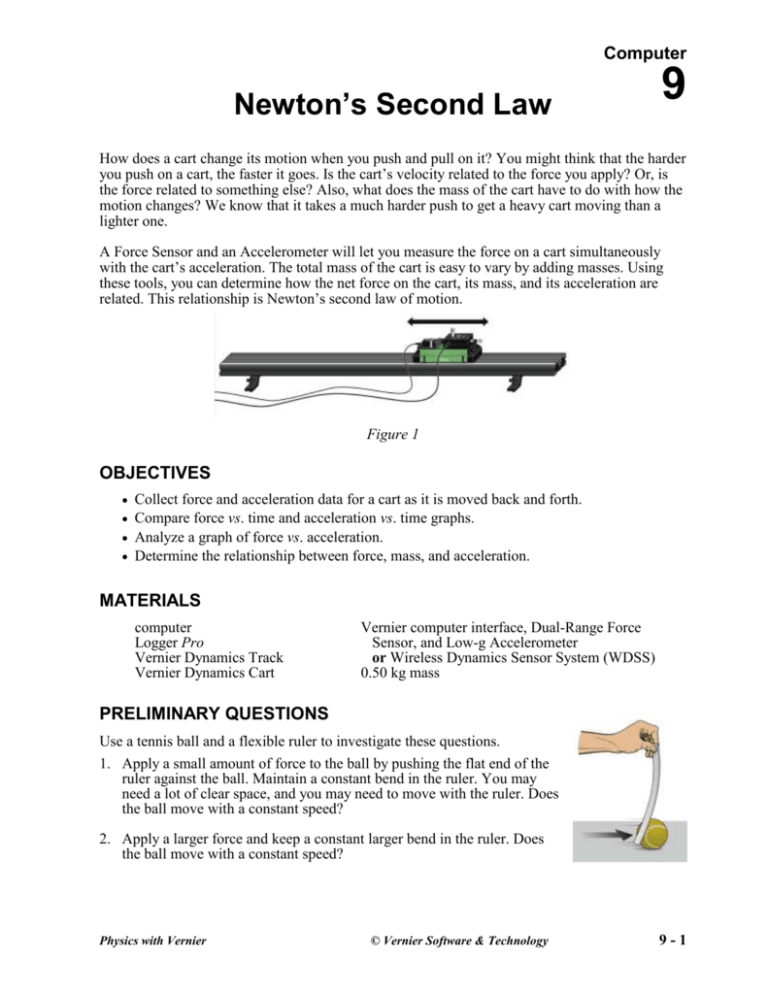
Computer Newton’s Second Law 9 How does a cart change its motion when you push and pull on it? You might think that the harder you push on a cart, the faster it goes. Is the cart’s velocity related to the force you apply? Or, is the force related to something else? Also, what does the mass of the cart have to do with how the motion changes? We know that it takes a much harder push to get a heavy cart moving than a lighter one. A Force Sensor and an Accelerometer will let you measure the force on a cart simultaneously with the cart’s acceleration. The total mass of the cart is easy to vary by adding masses. Using these tools, you can determine how the net force on the cart, its mass, and its acceleration are related. This relationship is Newton’s second law of motion. Figure 1 OBJECTIVES Collect force and acceleration data for a cart as it is moved back and forth. Compare force vs. time and acceleration vs. time graphs. Analyze a graph of force vs. acceleration. Determine the relationship between force, mass, and acceleration. MATERIALS computer Logger Pro Vernier Dynamics Track Vernier Dynamics Cart Vernier computer interface, Dual-Range Force Sensor, and Low-g Accelerometer or Wireless Dynamics Sensor System (WDSS) 0.50 kg mass PRELIMINARY QUESTIONS Use a tennis ball and a flexible ruler to investigate these questions. 1. Apply a small amount of force to the ball by pushing the flat end of the ruler against the ball. Maintain a constant bend in the ruler. You may need a lot of clear space, and you may need to move with the ruler. Does the ball move with a constant speed? 2. Apply a larger force and keep a constant larger bend in the ruler. Does the ball move with a constant speed? Physics with Vernier © Vernier Software & Technology 9-1 Computer 9 3. What is the difference between the movement when a small force is applied versus a large force? PROCEDURE Trial I 1. Set up the sensors and Logger Pro for data collection. Using Dual-Range Force Sensor and Accelerometer a. Set the range switch on the Dual-Range Force Sensor to 10 N. b. Attach the Force Sensor to a Dynamics Cart so you can apply a horizontal force to the hook, Figure 3 directed along the sensitive axis of the sensor (see Figure 3). c. Attach the Accelerometer so the arrow is horizontal and parallel to the direction that the cart will roll. Orient the arrow so that if you pull on the Force Sensor the cart will move in the direction of the arrow. d. Find the mass of the cart with the Force Sensor and Accelerometer attached. Record the mass in the data table. e. Connect the Force Sensor and Accelerometer to the Vernier computer interface. Using WDSS a. Attach the WDSS to the cart and find the mass of the cart with the WDSS attached. Record the mass in the data table. b. Turn on the WDSS. Note the name on the label of the device. c. Activate Bluetooth on your computer or connect a Bluetooth USB Adapter and ensure it is on. d. Start Logger Pro and choose Connect Interface from the Experiment menu. Select Wireless and then Scan for Wireless Device. If the WDSS is not found, try scanning again. e. A dialog box is displayed showing your WDSS on the list of available devices. Select your WDSS and then click . 2. Open the file “09 Newtons Second Law” from the Physics with Vernier folder. 3. To zero the sensors, place the cart on the Dynamics Track on a level surface. Verify the cart is not moving and click . Check that both Accelerometer and Force are selected and click . 4. You are now ready to collect force and acceleration data. Grasp the Force Sensor or WDSS hook. Click and roll the cart back and forth along the track covering a distance of about 10 cm. Vary the motion so that both small and large forces are applied. Your hand must touch only the hook and not the sensors or cart body. Only apply force along the track so that no frictional forces are introduced. 5. Note the shape of the force vs. time and acceleration vs. time graphs. How are the graphs similar? How are they different? 9-2 Physics with Vernier Newton’s Second Law 6. Click Examine, , and move the mouse across the force vs. time graph. When the force is maximum, is the acceleration maximum or minimum? To turn off Examine mode, click Examine, , again. 7. The graph of force vs. acceleration should appear to be a straight line. To fit a straight line to the data, click the graph, then click Linear Fit, . Record the equation for the regression line in the data table. 8. Print copies of each graph. Trial II 9. Remove the Accelerometer, attach the 0.50 kg mass to the cart, and then re-attach the Accelerometer (see Figure 4). Record the total mass of the cart, sensors, and additional mass in the data table. 10. Repeat Steps 4–8. Figure 4 DATA TABLE Trial 1 Mass of cart with sensors (kg) Regression line for force vs. acceleration data Trial II Mass of cart with sensors and additional mass (kg) Regression line for force vs. acceleration data ANALYSIS 1. Are the net force on an object and the acceleration of the object directly proportional? Explain, using experimental data to support your answer. 2. What are the units of the slope of the force vs. acceleration graph? Simplify the units of the slope to fundamental units (m, kg, s). 3. For each trial, compare the slope of the regression line to the mass being accelerated. What does the slope represent? 4. Write a general equation that relates all three variables: force, mass, and acceleration. Physics with Vernier 9-3 Computer 9 EXTENSION Use this apparatus as a way to measure mass. Place an unknown mass on the cart. Measure the acceleration for a known force and determine the mass of the unknown. Compare your answer with the actual mass of the cart, as measured using a balance. 9-4 Physics with Vernier
