Blood Spatter Lab
advertisement

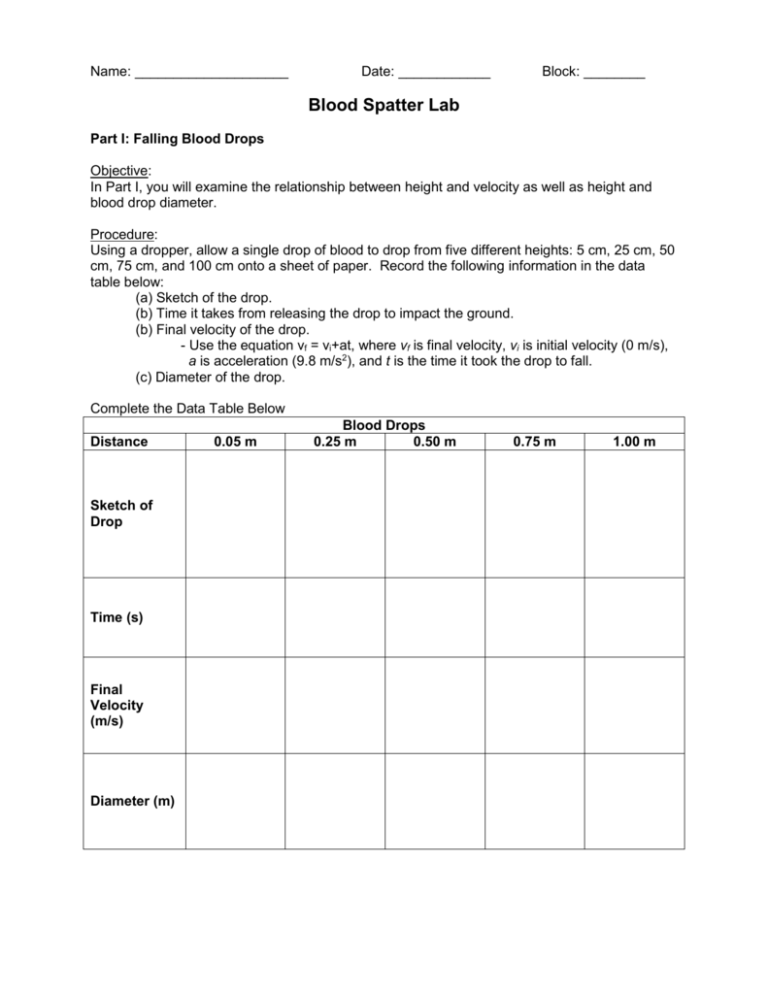
Name: ____________________ Date: ____________ Block: ________ Blood Spatter Lab Part I: Falling Blood Drops Objective: In Part I, you will examine the relationship between height and velocity as well as height and blood drop diameter. Procedure: Using a dropper, allow a single drop of blood to drop from five different heights: 5 cm, 25 cm, 50 cm, 75 cm, and 100 cm onto a sheet of paper. Record the following information in the data table below: (a) Sketch of the drop. (b) Time it takes from releasing the drop to impact the ground. (b) Final velocity of the drop. - Use the equation vf = vi+at, where vf is final velocity, vi is initial velocity (0 m/s), a is acceleration (9.8 m/s2), and t is the time it took the drop to fall. (c) Diameter of the drop. Complete the Data Table Below Distance Sketch of Drop Time (s) Final Velocity (m/s) Diameter (m) 0.05 m Blood Drops 0.25 m 0.50 m 0.75 m 1.00 m 1. Were you able to distinguish differences in shape between the 5 cm and 25 cm drop? Explain any differences. (1 point) 2. Using your data, complete the following graphs: (2 points each) a. Time vs. Distance b. Velocity vs. Distance c. Diameter vs. Distance 3. Examine your Time vs. Distance graph. What is the relationship between the time and the distance the blood drop fell? (1 point) 4. Examine your Velocity vs. Distance graph. What is the relationship between the final velocity and the distance the blood drop fell? (1 point) 5. Using your graph, determine the final velocity of a blood drop if it fell 0.65 meters. (1 point) 6. Examine your Diameter vs. Distance graph. What is the relationship between diameter of the blood drop and the distance the blood drop fell? (1 point) Procedure: Using the dropper, release a single drop of blood from 1.25 m and 1.75 m onto a sheet of paper. Draw each blood drop in the table below. Be sure to take the size of the drop into consideration. Blood Drops 1.25 m 1.75 m 7. In terms of velocity, why did the drops (in comparison to each other) look the way they did? (2 points) Name: ____________________ Date: ____________ Block: ________ Blood Spatter Lab Part II: Impact Angles Objective: In Part II, you will be able to calculate the impact angle of blood spatter. Procedure: Using a protractor and a dropper, allow a single drop of blood to drop from three angles: 25°, 45°, and 75° onto a sheet of paper. Record your data and answer the questions below. Draw a picture of each blood drop in the table below. Drop Angles 25° 45° 75° 1. Determine the relationship between the angle of impact and the shape of the blood drop. (1 point) 2. Using the equation sin c = width / length, calculate the angle for each trial (show your work in the space below). Did your calculated angle match the actual angle? (3 points) 25° Drop Angles Calculations 45° Did the calculated angled match the actual angle? 75° Name: ____________________ Date: ____________ Block: ________ Blood Spatter Lab Part III: Blood Spatter Objective: In Part III, you will use observations and calculations to determine how drop shape can be used to determine a blood drop’s velocity and impact angle. 1. Figure 1 shows blood spatter at low and high velocity from 10 cm and 20 cm. Indicate which spatter from each height was low velocity or high velocity. (2 points) 10 cm A B 20 cm C D 2. How were you able to distinguish between high and low velocity? (1 point) 3. Figure 2 shows blood drops from different heights: 1 cm, 10 cm, 30 cm, 40 cm, 50 cm, 75 cm, and 100 cm. Rank the blood drops in order from lowest to highest. (3 points) 1 cm - _________ 10 cm - _________ 50 cm - _________ 30 cm - _________ 75 cm - _________ 40 cm - _________ 100 cm - _________ 4. In terms of velocity and drop shape, how were you able to determine the drop height order? (1 point) Velocity: Drop Shape: 5. Figures 3 and 4 show blood spatter at different angles. Calculate the angles for each using the equation: sin c = width / length. Show your work in the space below. (6 points) A B C D E F Calculations Angles


