Yeast and fermentation: Sucrose vs. Glucose
Bloemen, V., Sommen, C. van der
Gymnasium Haganum, The Netherlands (April 2010)
Summary
Yeasts are eukaryotic micro-organisms classified in the kingdom Fungi. Yeast has the ability to
ferment glucose into ethanol and carbon dioxide. Yeast, being part of the fungus family, operates
in an anaerobe environment. Sucrose is a disaccharide and hydrolyzed into glucose and fructose.
In the experiment by Slaa etc. they begin with sucrose, but for the fermentation they use only
glucose. This implies that the presence of fructose does not serve any purpose in the
fermentation process. However, seeing that fructose and glucose have the same molecular
formula, this does not seem very likely. The amount of carbon dioxide produced during the
fermentation process was observed first when using sucrose (glucose + fructose) and
afterwards when using only glucose. This resulted in the conclusion that sucrose produces a
higher amount of carbon dioxide, and therefore also a higher amount of ethanol, then when only
glucose is used. This means that fructose also produces carbon dioxide. However, the molar ratio
of the two amounts does not equal 1:2, expected when fructose would produce the same amount
of carbon dioxide as glucose, but 1:1,6. This might be caused by the fact that fructose has another
optimal temperature than glucose.
© 2010 Vera Bloemen and Cecile van der Sommen. All rights reserved.
Introduction
The ‘regular’ sugar from the stores is no
glucose, but is a disaccharide, a sugar
composed of two different monosaccharides.
This ‘regular’ sugar is called sucrose
(C12H22O11). Before the fermentation of glucose
to ethanol starts, first the sucrose has to be
hydrolyzed. One molecule of sucrose reacts
with one molecule of water. This division takes
place under influence of invertase. This is an
enzyme found in yeast. This results in one
molecule D-glucose and one molecule Dfructose per molecule sucrose.
C12H22O11 (s) + H2O (l) invertase
C6H12O6 (s) + C6H12O6 (s)
(glucose)
(fructose)
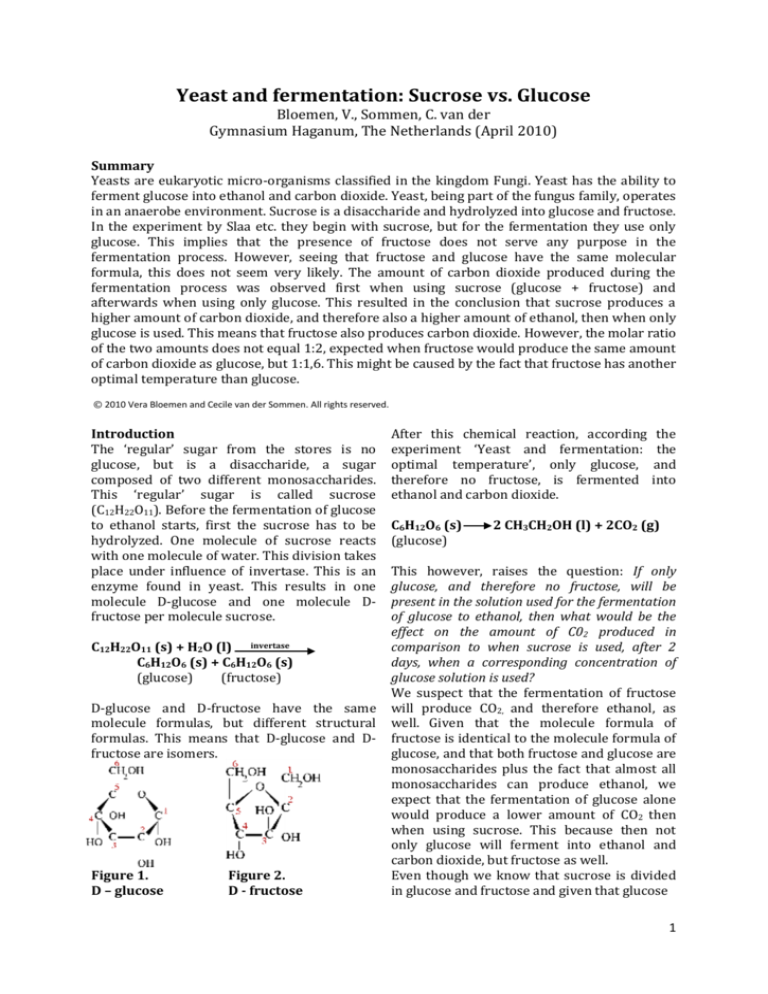
D-glucose and D-fructose have the same
molecule formulas, but different structural
formulas. This means that D-glucose and Dfructose are isomers.
Figure 1.
D – glucose
Figure 2.
D - fructose
After this chemical reaction, according
experiment ‘Yeast and fermentation:
optimal temperature’, only glucose,
therefore no fructose, is fermented
ethanol and carbon dioxide.
C6H12O6 (s)
(glucose)
the
the
and
into
2 CH3CH2OH (l) + 2CO2 (g)
This however, raises the question: If only
glucose, and therefore no fructose, will be
present in the solution used for the fermentation
of glucose to ethanol, then what would be the
effect on the amount of C02 produced in
comparison to when sucrose is used, after 2
days, when a corresponding concentration of
glucose solution is used?
We suspect that the fermentation of fructose
will produce CO2, and therefore ethanol, as
well. Given that the molecule formula of
fructose is identical to the molecule formula of
glucose, and that both fructose and glucose are
monosaccharides plus the fact that almost all
monosaccharides can produce ethanol, we
expect that the fermentation of glucose alone
would produce a lower amount of CO2 then
when using sucrose. This because then not
only glucose will ferment into ethanol and
carbon dioxide, but fructose as well.
Even though we know that sucrose is divided
in glucose and fructose and given that glucose
1
and fructose do have the same molecule
formula, but a different structural formula, and
are therefore isomer from each other, this does
not instantly imply that they have the same
features and that they produce the same
amount of CO2.
Experimental procedure and approach
We began to mark, with aid of a permanent
marker, three plastic 0,5L Coca Cola bottles:
bottle A, B and C. Then we filled the three
bottles entirely with water, measuring the
amount of water in the bottles, when filled to
the top (0,33 L). In the three test tubes we put
a 0,25 mol/L sucrose –solution. This sucrosesolution was made by solving 4,28 grams of
sucrose in 0,05 L distilled water (the volume of
a test tube). Next we added 0,2 grams of
baker’s yeast. The three bottles are placed, at
the same time, upside down in a (not warm)
water bath, while using elastics. The three test
tubes are put in a warm water bath with an
optimal temperature for the fermentation of
glucose, 35°C. The three test tubes, containing
the sucrose solution and yeast are closed with
a cap. From this cap leads a abduction tube
which is connected with the three bottles. At
the end of the fermentation, we calculated, by
comparing the water levels from the bottles of
before and after the fermentation, the amount
of produced C02 in milliliters. We did the same
with three bottles of yeast and only glucosesolution. After we also calculated the amount
of CO2 produced when using only glucose, we
could compare the results. The final outcome
will be averaged and converted into moles.
Results
After two days the fermentation process was
largely finished and the water levels were
down quite a bit. The following tables present,
in triplicate, the amount of CO2 (in mL and
mol) produced at the fermentation of, in table
1 sucrose and in table 2, glucose.
Table 1. Amount of CO2 after fermentation of
sucrose
Table 2. Amount of CO2 after fermentation of
glucose
Data analysis
The amount of CO2 produced when using
sucrose is 5,4 x 10^-3 mol and is therefore
higher than the amount of CO2 produced when
using only glucose, which is an amount of 3,4 x
10^-3.
The difference between the amount of CO2
produced when using sucrose and when using
only glucose for the fermentation is 5,4 x 10^3 – 3.4 x 10^-3 = 2 x 10 ^-3 mol.
This means that the molar ratio of the
produced amounts of CO2 is 1:1,6.
In the chemical reaction of fermentation the
molar ratio of ethanol and CO2 is 1:1, this
means that the molar ratio of the produced
amounts of ethanol is 1:1,6 as well.
Conclusions and discussion
The observation that in all bottles the water
level drops indicates that in all test tubes the
fermentation reaction took place and that in all
test tubes ethanol and carbon dioxide were
produced. In the data analysis we found that
the amount of CO2 produced with sucrose is
higher than the amount of CO2 produced with
glucose.
If fructose and glucose would produce the
same amount of CO2, the molar ratio of the
amount of CO2 produced by sucrose and the
amount produced by only glucose, would be
1:2. However, the molar ratio between those
amounts equals 1:1,6. This implies that glucose
produces more CO2, and therefore more
ethanol, than fructose. This could mean that
either we have overlooked some of the control
variables or that a mistake has been made
while measuring or calculating. Another point
which might have effected our results in a
negative way is that because the set-up was a
closed system, pressure may have been
increased by the produced CO2, influencing
the fermentation process. Moreover, the CO2
may, also because of the pressure, have
2
dissolved in the water and is therefore not
included in the measurements.
However, the most probable possibility is that
the optimal temperature for the fermentation
of glucose is another temperature than the
optimal temperature for the fermentation of
fructose.
This could be explained by the difference
between the structural formulas, the influence
of temperature is defined by the bolds
between the chemical compounds.
This raises a further question for inquiry: what
is the optimal temperature for the
fermentation of fructose?
Bibliography
1. Slaa, J. Gnode, M., & Else, H. (2009).
Yeast and fermentation: the optimal
temperature
Journal of organic chemistry
2. Bekkers, R., Camps, M., Pieren, L.
(2003)
Pulsar-Chemie
3. http://scholar.google.nl/scholar?q=glu
cose+fermentation+yeast&hl=nl&as_sd
t=0&as_vis=1&oi=scholart
3

