Tables, rules and graphs
advertisement
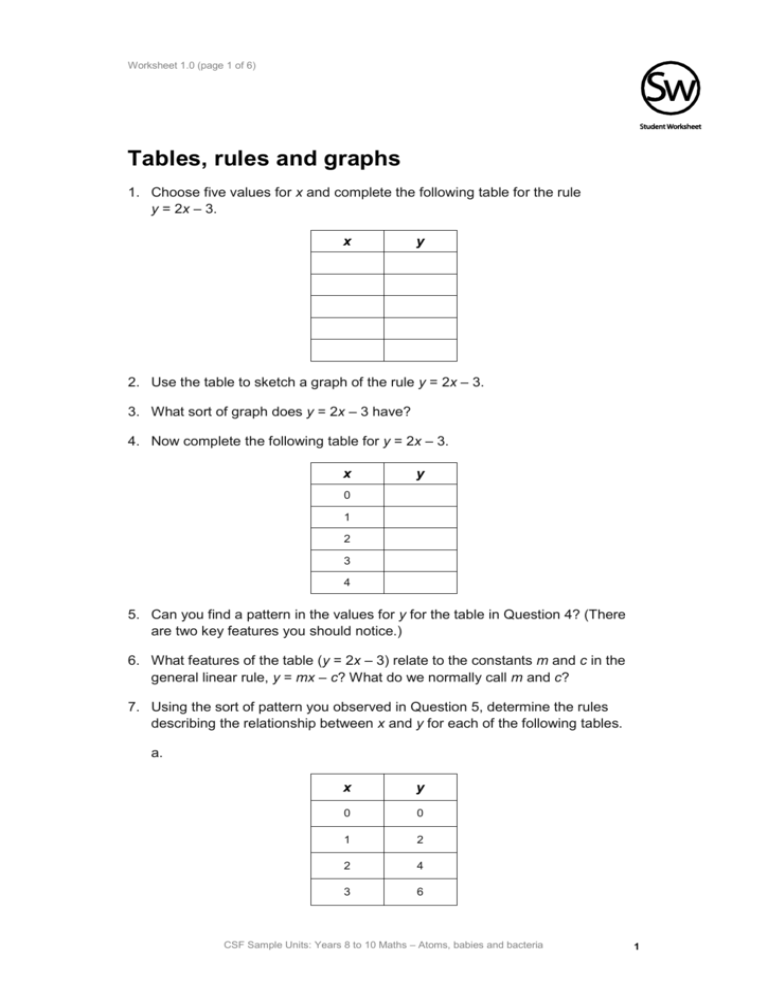
Worksheet 1.0 (page 1 of 6) Tables, rules and graphs 1. Choose five values for x and complete the following table for the rule y = 2x – 3. x y 2. Use the table to sketch a graph of the rule y = 2x – 3. 3. What sort of graph does y = 2x – 3 have? 4. Now complete the following table for y = 2x – 3. x y 0 1 2 3 4 5. Can you find a pattern in the values for y for the table in Question 4? (There are two key features you should notice.) 6. What features of the table (y = 2x – 3) relate to the constants m and c in the general linear rule, y = mx – c? What do we normally call m and c? 7. Using the sort of pattern you observed in Question 5, determine the rules describing the relationship between x and y for each of the following tables. a. x y 0 0 1 2 2 4 3 6 CSF Sample Units: Years 8 to 10 Maths – Atoms, babies and bacteria 1 Worksheet 1.0 (page 2 of 6) 4 8 x y 0 1 1 5 2 9 3 13 4 17 x y 0 –1 1 2 2 5 3 8 4 11 x y 0 –2 1 –5 2 –8 3 –11 4 –14 b. c. d. CSF Sample Units: Years 8 to 10 Maths – Atoms, babies and bacteria 2 Worksheet 1.0 (page 3 of 6) 8. Take out 33 dominoes and in small groups set up the dominoes so that the first domino hits two dominoes and those two dominoes hit another two dominoes each, and so on. (The dominoes need to be rotated slightly so that the ‘domino effect’ works properly.) The process is summarised in the following diagram. Push this domino Continue in this way until all the dominoes are laid out a. Tip the first domino towards the two dominoes and watch what happens. b. Complete the following table showing how many dominoes fall after each successive hit. Domino hits (h) Number of dominoes (n) 0 1 2 3 4 c. Can you guess the rule for this table? 9. Choose five values for x and complete the following table for the rule y = 5 2x. x y CSF Sample Units: Years 8 to 10 Maths – Atoms, babies and bacteria 3 Worksheet 1.0 (page 4 of 6) 10. Use the table to sketch a graph of the rule y = 5 2x. 11. What sort of rule is y = 5 2x? 12. Now complete the following table for y = 5 2x. x y 0 1 2 3 4 13. Can you find a pattern in the values for y for the table in Question 12? (There are two key features you should notice.) 14. What features of the table relate to the constants a and b in the general exponential rule y = a bx? What do we call a and b? 15. Using the sort of pattern you observed in Question 13, determine the rules describing the relationship between x and y for each the following tables. a. x y 0 2 1 4 2 8 3 16 4 32 CSF Sample Units: Years 8 to 10 Maths – Atoms, babies and bacteria 4 Worksheet 1.0 (page 5 of 6) b. x y 0 5 1 10 2 20 3 40 4 80 c. x y 0 2 1 10 2 50 3 250 4 1250 x y 0 10 1 5 2 2.5 3 1.25 4 0.675 d. 16. Use your answers to Question 15 to predict values for the following. a. y, if x = 23 b. y, if x = 6 c. y, if x = 8 d. y, if x = 10 CSF Sample Units: Years 8 to 10 Maths – Atoms, babies and bacteria 5 Worksheet 1.0 (page 6 of 6) 17. Use a computer graphing package or graphing calculator to draw the following functions. a. y = 2 2x b. y = 5 2x c. y = 0.5 2x d. y = 2 3x e. y = 5 3x f. y = 0.5 3x g. y = 2 0.8x h. y = 5 0.8x i. y = 0.5 0.8x Visit the website archives.math.utk.edu/visual.calculus/0/parameters.5/ and explore the effects of changing the growth factor on an exponential graph. 18. Describe the effects the constants a and b have on the graph y = a bx. (Use words such as ‘dilates’ instead of ‘stretches’ and ‘translates’ instead of ‘shifts’.) CSF Sample Units: Years 8 to 10 Maths – Atoms, babies and bacteria 6

