Acoustic Phonetics Picture Book (June11th)
advertisement
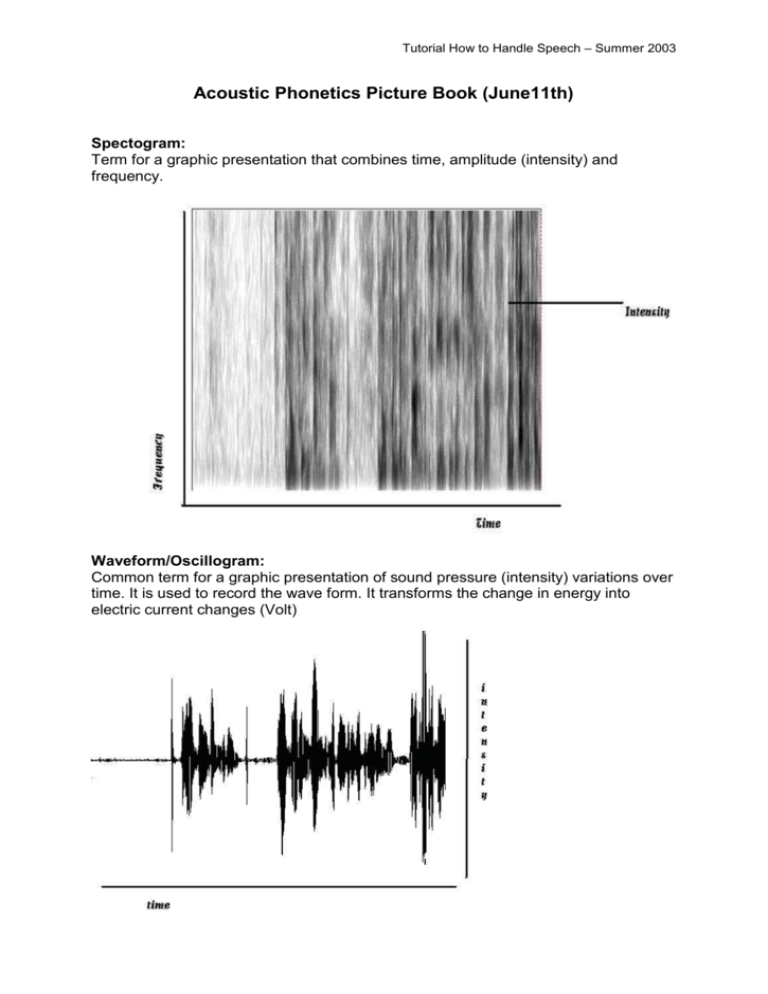
Tutorial How to Handle Speech – Summer 2003 Acoustic Phonetics Picture Book (June11th) Spectogram: Term for a graphic presentation that combines time, amplitude (intensity) and frequency. Waveform/Oscillogram: Common term for a graphic presentation of sound pressure (intensity) variations over time. It is used to record the wave form. It transforms the change in energy into electric current changes (Volt) Tutorial How to Handle Speech – Summer 2003 Intensity: The instrumentally measurable factor corresponding to the loudness of a sound. It is derivable from the amplitude or amount of increase in air pressure and can be defined as the average rate of sound energy falling on a unit area. Intensity is a physical property of sounds and is dependent on the amount of energy present. Perceptually, there is a fairly close relationship between physical intensity and perceived loudness. Frequency of vibration is the number of cycles per second (measured in Hertz). The vibration of for instance a pendulum can be displayed as a sine wave in a graph that plots vibration (displacement) against time. When the wave meets the axis for the second time, it has completed one cycle respectively the pendulum has swung left and right and is back in its neutral position. A sound consists of many different frequencies being a result of complex vibration. Briefly said frequency refers to the vibration involved in the production of a sound in a specific period of time. Tutorial How to Handle Speech – Summer 2003 Formants are the peaks of energy visible in a spectrogram. These peaks of energy are produced by tract resonance. The information-bearing formants are numbered upwards from the lowest in frequency (F1, F2, etc.). They function in acoustic analyses as indicators for the distribution of energy on the frequencies. Therefore they are essential parameters in the acoustic description of sounds. Not all five formants are visible in every sound.


