Lab 06 Functional fi.. - University of Maryland
advertisement
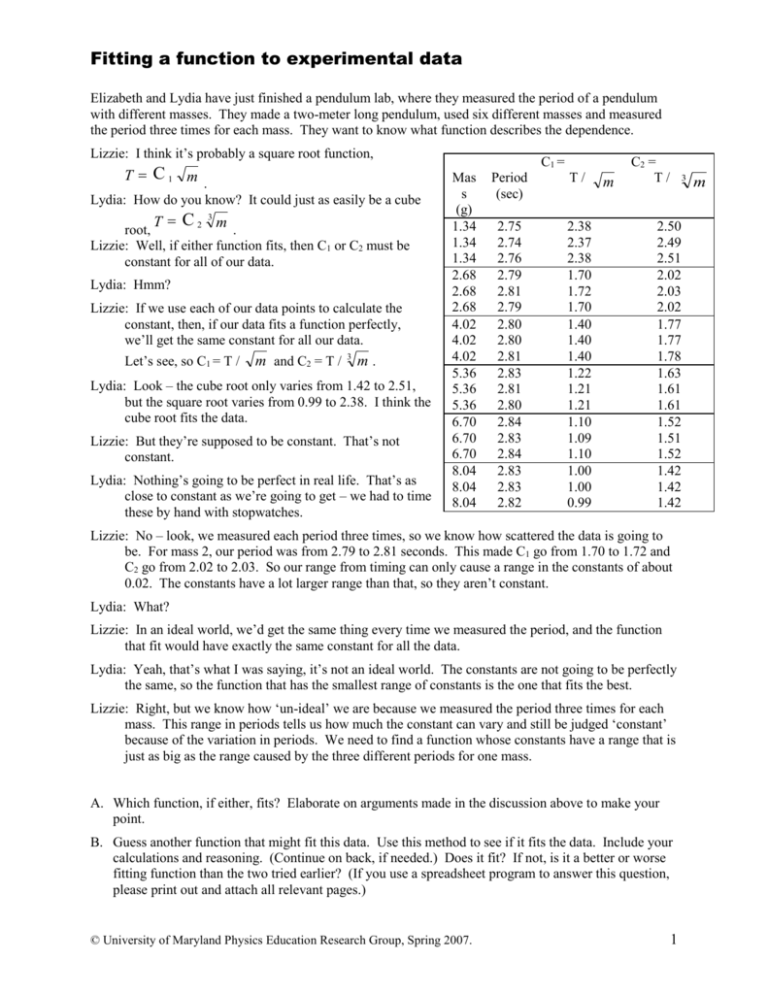
Fitting a function to experimental data Elizabeth and Lydia have just finished a pendulum lab, where they measured the period of a pendulum with different masses. They made a two-meter long pendulum, used six different masses and measured the period three times for each mass. They want to know what function describes the dependence. Lizzie: I think it’s probably a square root function, T C1 m . Lydia: How do you know? It could just as easily be a cube T C 3 m 2 root, . Lizzie: Well, if either function fits, then C1 or C2 must be constant for all of our data. Lydia: Hmm? Lizzie: If we use each of our data points to calculate the constant, then, if our data fits a function perfectly, we’ll get the same constant for all our data. Let’s see, so C1 = T / m and C2 = T / 3 m. Lydia: Look – the cube root only varies from 1.42 to 2.51, but the square root varies from 0.99 to 2.38. I think the cube root fits the data. Lizzie: But they’re supposed to be constant. That’s not constant. Lydia: Nothing’s going to be perfect in real life. That’s as close to constant as we’re going to get – we had to time these by hand with stopwatches. C1 = Mas s (g) 1.34 1.34 1.34 2.68 2.68 2.68 4.02 4.02 4.02 5.36 5.36 5.36 6.70 6.70 6.70 8.04 8.04 8.04 Period (sec) T/ 2.75 2.74 2.76 2.79 2.81 2.79 2.80 2.80 2.81 2.83 2.81 2.80 2.84 2.83 2.84 2.83 2.83 2.82 2.38 2.37 2.38 1.70 1.72 1.70 1.40 1.40 1.40 1.22 1.21 1.21 1.10 1.09 1.10 1.00 1.00 0.99 m C2 = T/ 3 2.50 2.49 2.51 2.02 2.03 2.02 1.77 1.77 1.78 1.63 1.61 1.61 1.52 1.51 1.52 1.42 1.42 1.42 Lizzie: No – look, we measured each period three times, so we know how scattered the data is going to be. For mass 2, our period was from 2.79 to 2.81 seconds. This made C1 go from 1.70 to 1.72 and C2 go from 2.02 to 2.03. So our range from timing can only cause a range in the constants of about 0.02. The constants have a lot larger range than that, so they aren’t constant. Lydia: What? Lizzie: In an ideal world, we’d get the same thing every time we measured the period, and the function that fit would have exactly the same constant for all the data. Lydia: Yeah, that’s what I was saying, it’s not an ideal world. The constants are not going to be perfectly the same, so the function that has the smallest range of constants is the one that fits the best. Lizzie: Right, but we know how ‘un-ideal’ we are because we measured the period three times for each mass. This range in periods tells us how much the constant can vary and still be judged ‘constant’ because of the variation in periods. We need to find a function whose constants have a range that is just as big as the range caused by the three different periods for one mass. A. Which function, if either, fits? Elaborate on arguments made in the discussion above to make your point. B. Guess another function that might fit this data. Use this method to see if it fits the data. Include your calculations and reasoning. (Continue on back, if needed.) Does it fit? If not, is it a better or worse fitting function than the two tried earlier? (If you use a spreadsheet program to answer this question, please print out and attach all relevant pages.) © University of Maryland Physics Education Research Group, Spring 2007. 1 m


