IB Chemistry—IA Checklist
advertisement
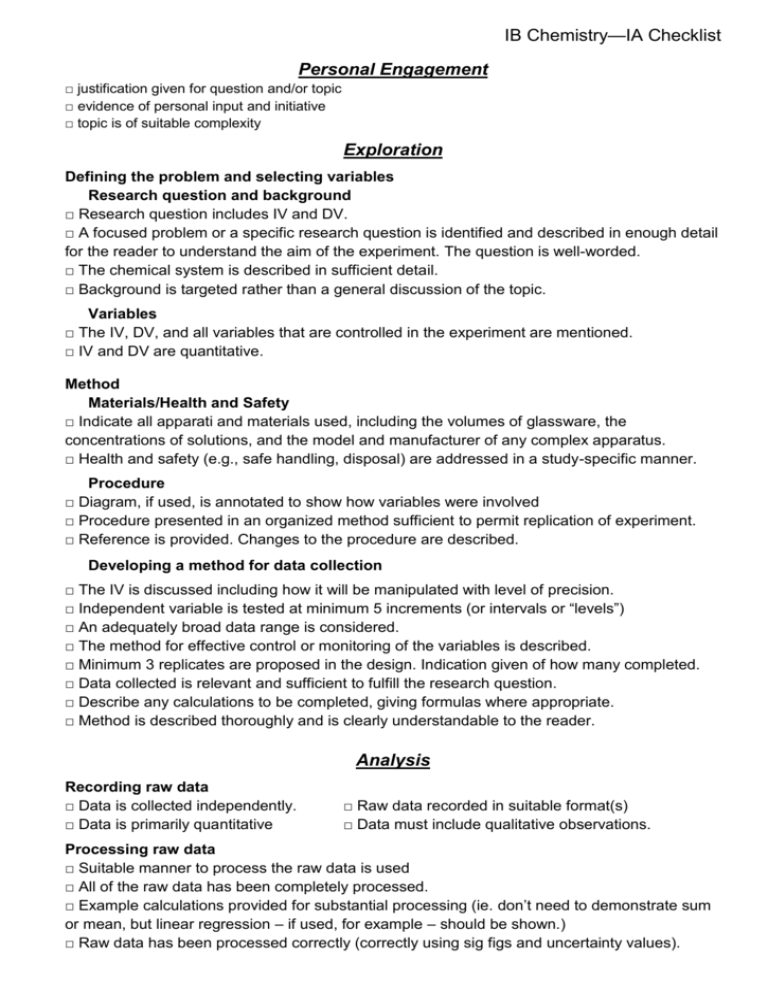
IB Chemistry—IA Checklist Personal Engagement □ justification given for question and/or topic □ evidence of personal input and initiative □ topic is of suitable complexity Exploration Defining the problem and selecting variables Research question and background □ Research question includes IV and DV. □ A focused problem or a specific research question is identified and described in enough detail for the reader to understand the aim of the experiment. The question is well-worded. □ The chemical system is described in sufficient detail. □ Background is targeted rather than a general discussion of the topic. Variables □ The IV, DV, and all variables that are controlled in the experiment are mentioned. □ IV and DV are quantitative. Method Materials/Health and Safety □ Indicate all apparati and materials used, including the volumes of glassware, the concentrations of solutions, and the model and manufacturer of any complex apparatus. □ Health and safety (e.g., safe handling, disposal) are addressed in a study-specific manner. Procedure □ Diagram, if used, is annotated to show how variables were involved □ Procedure presented in an organized method sufficient to permit replication of experiment. □ Reference is provided. Changes to the procedure are described. Developing a method for data collection □ The IV is discussed including how it will be manipulated with level of precision. □ Independent variable is tested at minimum 5 increments (or intervals or “levels”) □ An adequately broad data range is considered. □ The method for effective control or monitoring of the variables is described. □ Minimum 3 replicates are proposed in the design. Indication given of how many completed. □ Data collected is relevant and sufficient to fulfill the research question. □ Describe any calculations to be completed, giving formulas where appropriate. □ Method is described thoroughly and is clearly understandable to the reader. Analysis Recording raw data □ Data is collected independently. □ Data is primarily quantitative □ Raw data recorded in suitable format(s) □ Data must include qualitative observations. Processing raw data □ Suitable manner to process the raw data is used □ All of the raw data has been completely processed. □ Example calculations provided for substantial processing (ie. don’t need to demonstrate sum or mean, but linear regression – if used, for example – should be shown.) □ Raw data has been processed correctly (correctly using sig figs and uncertainty values). IB Chemistry—IA Checklist Presenting processed data □ Suitable format in which to present the processed data is used. □ Any graphs have appropriate scales, labelled axes with units and accurately plotted data points with a suitable best-fit line or curve if necessary. Data can be extracted from graphs. □ All the processing stages can be followed easily (explanations are clear when needed). □ Uncertainties of raw data have been taken into account and that work is shown. □ Final results have the correct number of sig figs, as determined by absolute uncertainty. Evaluation Making Conclusions □ A conclusion, which is based on a reasonable interpretation of the data, is made. □ Actual processed data used in conclusion (e.g. quote your data!) □ Is there a clear pattern in your processed data? Different graphs are compared or trends in graphs are made explicit. □ A justification is given for your conclusion. Reasons for observed trends are written explicitly. Experimental groups are compared with controls or theoretical expectations. □ If an already known and accepted value is being measured, values have been compared with that in a textbook or other reference, in order to assess the validity of the result. o Percentage deviation/error is mentioned in this case. o Uncertainty analysis must be used to explicitly conclude whether the experimental result is equivalent to the accepted value. □ Any literature/references used is fully referenced. Evaluating procedures □ The design, method and precision of the investigation have been evaluated. □ Measurement and instrument errors (including possibility of calibration errors - when appropriate) are analyzed to evaluate the accuracy of measurements. □ Random error is evaluated, including any uncontrollable random variations in samples. □ Specific sources of error are identified. Each error is explained thoroughly and clearly: How might each have impacted the results? Improving the investigation □ All improvements are based on the weaknesses and limitations identified. The specific errors mentioned are the ones corrected. □ Modifications to the experimental technique are appropriate to correct errors mentioned. □ All proposed modifications are realistic (they are actually variables that can be controlled). □ All proposed modifications are clearly explained. Communication □ Report is logically presented (i.e., no need for teacher to re-read it). □ Information is study-specific rather than a vague, general discussion. □ Subject-specific conventions are followed: correct formats for tables, graphs, units, uncertainties, etc. IB Chemistry—IA Checklist Formatting Tables and Figures Table organization □ Includes descriptive title for any table, graph, etc. that is used. □ uses specific terms (ie. NaCl instead of salt; volume or length instead of amount or size) □ tables not split between pages □ tables show grid lines □ cells contains only one value □ align decimals □ uncertainty in headers. Absolute uncertainties expressed to 1 sig fig. □ Same level of precision is used for all the items of a variable □ Units for every variable (IB units). □ units in column headings, not in cells Graphing □ include simple title □ graph is large (whole page) □ simple scale □ scale has appropriate range (does not have to start at zero) □ Labels and units (IB convention) □ intervals proportional □ uncertainty shown (like mass (± 0.01 g))
