IB Chemistry IA Rubric: Design, Data, Conclusion
advertisement
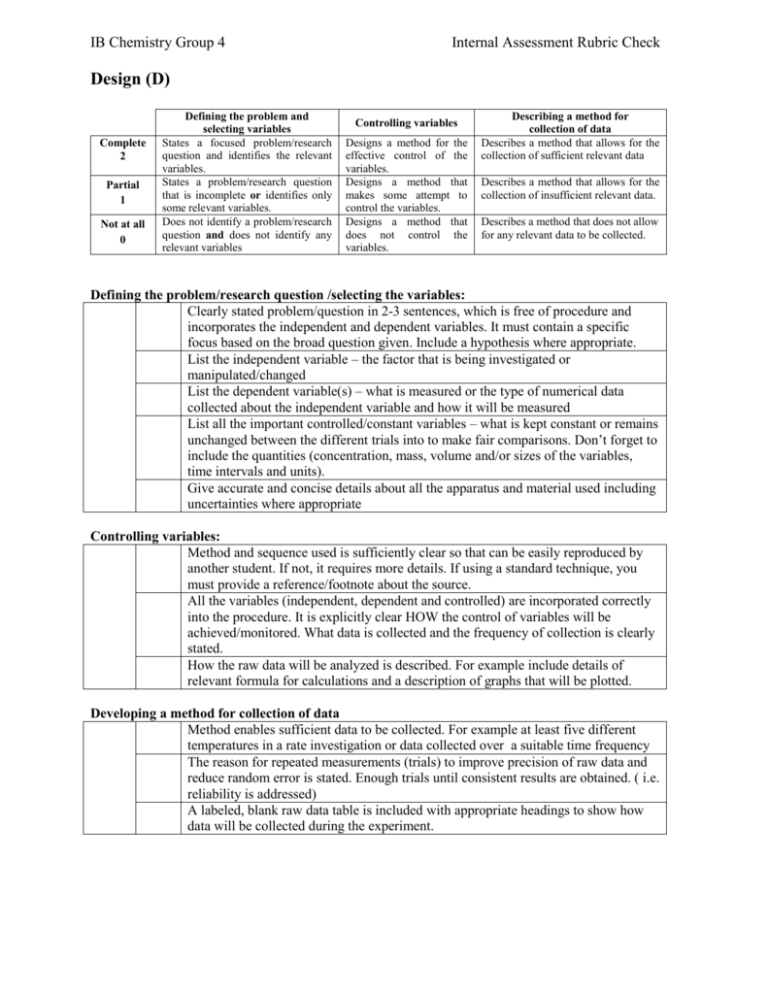
IB Chemistry Group 4 Internal Assessment Rubric Check Design (D) Complete 2 Partial 1 Not at all 0 Defining the problem and selecting variables States a focused problem/research question and identifies the relevant variables. States a problem/research question that is incomplete or identifies only some relevant variables. Does not identify a problem/research question and does not identify any relevant variables Controlling variables Designs a method for the effective control of the variables. Designs a method that makes some attempt to control the variables. Designs a method that does not control the variables. Describing a method for collection of data Describes a method that allows for the collection of sufficient relevant data Describes a method that allows for the collection of insufficient relevant data. Describes a method that does not allow for any relevant data to be collected. Defining the problem/research question /selecting the variables: Clearly stated problem/question in 2-3 sentences, which is free of procedure and incorporates the independent and dependent variables. It must contain a specific focus based on the broad question given. Include a hypothesis where appropriate. List the independent variable – the factor that is being investigated or manipulated/changed List the dependent variable(s) – what is measured or the type of numerical data collected about the independent variable and how it will be measured List all the important controlled/constant variables – what is kept constant or remains unchanged between the different trials into to make fair comparisons. Don’t forget to include the quantities (concentration, mass, volume and/or sizes of the variables, time intervals and units). Give accurate and concise details about all the apparatus and material used including uncertainties where appropriate Controlling variables: Method and sequence used is sufficiently clear so that can be easily reproduced by another student. If not, it requires more details. If using a standard technique, you must provide a reference/footnote about the source. All the variables (independent, dependent and controlled) are incorporated correctly into the procedure. It is explicitly clear HOW the control of variables will be achieved/monitored. What data is collected and the frequency of collection is clearly stated. How the raw data will be analyzed is described. For example include details of relevant formula for calculations and a description of graphs that will be plotted. Developing a method for collection of data Method enables sufficient data to be collected. For example at least five different temperatures in a rate investigation or data collected over a suitable time frequency The reason for repeated measurements (trials) to improve precision of raw data and reduce random error is stated. Enough trials until consistent results are obtained. ( i.e. reliability is addressed) A labeled, blank raw data table is included with appropriate headings to show how data will be collected during the experiment. Data collection and data processing (DCP) Complete 2 Partial 1 Not at all 0 Recording raw data Records appropriate quantitative and associated qualitative raw data, including units and uncertainties where relevant. Processing raw data Processes the quantitative raw data correctly. Presenting processed data Presents processed data appropriately and, where relevant, includes errors and uncertainties. Records appropriate quantitative and associated qualitative raw data, but with some mistakes or omissions Does not record any appropriate quantitative raw data or raw data is incomprehensible. Processes quantitative raw data but with some mistakes and/or omissions. No processing of quantitative raw data is carried out or major mistakes are made in processing. Presents processed data appropriately but with some mistakes and/or omissions. Presents processed data inappropriately or incomprehensibly. Recording raw data: Record all raw data into an appropriate data table. Raw data is actual measured data. You must undertake the recording and processing independently. Your table must not look like your partner. All units of measurement and absolute uncertainties are estimated and that magnitude recorded correctly. The uncertainty on averages is calculated and shown with working. Include all qualitative data to describe what is observed during the investigation. You may for example observe a colour change or a precipitate form. Processing raw data: Complete and correct quantitative analysis of the data is carried out including calculations using formulae and average calculations. At least one sample per calculation showing the steps involved is shown. Identical calculations do not need to be repeated. For repeated trials, the final result for each trial is calculated. Average results are calculated based on the final results of repeated trials. Exclusion of any trials/collected data is stated and justified Final average result of repeated trials is used for plotting graphs not individual trials. Significant figures and units are used correctly in calculations. One extra significant figure is kept throughout the entire calculation to reduce rounding errors. The final result is consistent with the number of significant figures in the experimental measurements. Uncertainties are propagated through a calculation and expressed as percentages. Experimental uncertainty transformed to the ± amount pertaining to the actual result. Uncertainty should be estimated if only one measurement is done. NOTE: Final average result of repeated trials is used for the calculation of experimental uncertainty. Include/estimate any other errors or uncertainties which may affect the validity or your result. Presenting processed data: Processed data and/or conclusions are summarized in a table or in some other easily interpretable manner so that all propagation to the final result can be followed including errors/uncertainties. You have used labelled, titled tables, graphs, charts, flow diagrams where possible/appropriate You have used metric/SI units in your answers to the correct number of significant figures Graphs should: have the axes labelled with the independent variable on the x axis and the dependent variable on the y axis include units of measurement for each variable in brackets have an appropriate scale for the data be an appropriate size (at least ½ page) have a key/legend for two or more sets of data on the same graph is clear be called a figure and numbered consecutively with a concise descriptive title that describes the dependent (x axis) and the independent (y axis) underneath the graph have accurately plotted data N.B Draw the line or curve of best fit for graphical data. Plotting scatter graphs with data point to data point connecting lines without a best fit line is not appropriate. Uncertainty bars are not required but can be used. N.B Electronic graph must be individually formatted Conclusion and evaluation (CE) Concluding Complete 2 Partial 1 Not at all 0 Evaluating procedure(s) Improving the investigation States a conclusion, with justification, based on a reasonable interpretation of the data. Evaluates weaknesses and limitations Suggests realistic improvements in respect of identified weaknesses and limitations States a conclusion based on a reasonable interpretation of the data. Identifies some weaknesses and limitations but the evaluation is weak or missing. Suggests only superficial improvements. States no conclusion or the conclusion is based on an unreasonable interpretation of the data. Identifies irrelevant weaknesses and limitations Suggests unrealistic improvements Concluding: A statement is made that indicates whether the aim/purpose/research question was achieved. This is stated explicitly and relates back to the details of the aim. Include a valid conclusion (summarize and explain your results) The hypothesis is restated (if there is one) and it is stated whether it was supported in the investigation. If it was incorrect rewrite it as a correct statement. Your conclusion should support your data even if it contradicts apparent theories. Compare your result to the expected value or result if possible. Calculate the percentage of error from the expected value.. % Error = │(Experimental – Accepted) ÷ Accepted│x 100 Justification: Comment on the difference between the % Error and % Uncertainty. If the % Error > % experimental uncertainty, systematic errors are the main source of error(include direction of error-up/down). If the % Error < % Experimental uncertainty, random errors are the main source of error. To overcome this problem the experiment needs to be repeated more times. Evaluating procedure: Evaluate your method. Describe the sources of systematic error and/or random error encountered and difficulties with the control of variables. State any assumptions that were made which may affect the result. Comment on the quality of the data. Describe the effect of the systematic error on the magnitude and direction (result too high or too low) on the final result. Comment on precision and accuracy. Comment on the limitations of the method chosen by identifying any weaknesses and show an awareness of how significant the weaknesses are. You have considered processes, equipment and management of time Improving the investigation: Suggest and explain feasible ways the investigation could be improved so there is more agreement with what is expected These modifications should address ways to reduce the systematic and random errors described previously, achieve better control of the variables, reduce approximations or provide better procedures for measurement These modifications should address the precision, the accuracy and reproducibility of the result. Improvements need to be specific (not vague) and realistic and lead to significant improvement in experimentation. They should not involve unavailable equipment or materials. Completing more trials is only a feasible improvement if it could improve the reliability of the results or reduce random errors. NOTE Obtaining better equipment, more practice, avoiding spillage and spending more time on the experiment ARE NOT FEASIBLE IMPROVEMENT. The best improvements are those that can be carried out with the current schools resources.
