The General Elution Problem Look at the chromatogram below in
advertisement
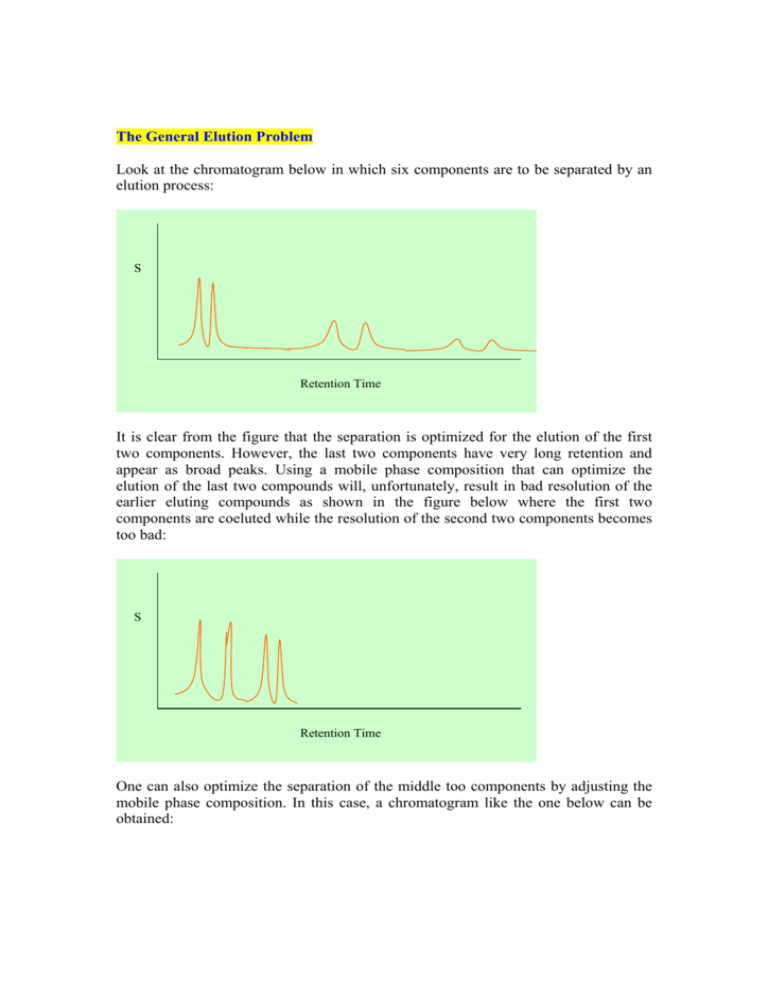
The General Elution Problem Look at the chromatogram below in which six components are to be separated by an elution process: S Retention Time It is clear from the figure that the separation is optimized for the elution of the first two components. However, the last two components have very long retention and appear as broad peaks. Using a mobile phase composition that can optimize the elution of the last two compounds will, unfortunately, result in bad resolution of the earlier eluting compounds as shown in the figure below where the first two components are coeluted while the resolution of the second two components becomes too bad: S Retention Time One can also optimize the separation of the middle too components by adjusting the mobile phase composition. In this case, a chromatogram like the one below can be obtained: S Retention Time However, in chromatographic separations, we are interested in fully separating all components in an acceptable resolution. Therefore, it is not acceptable to optimize the separation for a single component while disregarding the others. The solution of this problem can be achieved by consecutive optimization of individual components as the separation proceeds. In this case, the mobile phase composition should be changed during the separation process. First, a mobile phase composition suitable for the separation of the first eluting component is selected, and then the mobile phase composition is changed so that the second component is separated and so on. The change in mobile phase composition can be linear, parabolic, step, or any other formula. The chromatographic separation where the mobile phase composition is changed during the elution process is called gradient elution. A separation like the one below can be obtained: S Retention Time Qualitative Analysis Usually, the retention time of a solute is the qualitative indicator of a specific analyte. The retention time of an analyte is thus compared to that of a standard. If both have the same retention time, this may be a good indication that the identity of the analyte is most probably that of the standard. However, there can be important uncertainties since some different compounds have similar retention. In such cases, it is not wise to use the retention time as a guaranteed marker of the identity of compound, except in cases where the sample composition is known. Development in qualitative analysis in chromatography involves use of detectors that can give structural details of solutes, like diode array, Fourier transform infrared, mass spectrometers, etc. In such cases, qualitative analysis with high degree of certainty can be accomplished. It should therefore be clear that a similar retention time of a component and standard does not imply a100% identification but rather a good possibility. However, if the retention time of a compound in question does not match that of the standard, we are 100% sure that the anticipated compound is either absent or present at a concentration below the detection limit of the instrument. Quantitative Analysis Chromatographic separations provide very good and reliable information about quantitative analysis of sample constituents. Either the peak height or peak area can be used for quantitative analysis. Peak heights are easier and faster to use and usually result in good precision, especially when reproducible sample injections are made. However, late eluting peaks may have small peak heights but large width which may cause large errors. Peak areas are better for quantitative analysis as the area under the peak is integrated which is an accurate measure of concentration. However, this process is slow and tedious especially when it is to be manually performed or when the peak is very sharp. Generally, peak areas give better quantitative results. The Internal Standard Method Uncertainties in sample injection can be overcome by use of an internal standard. In this method, a measured quantity of an internal standard is added to both standard and sample, and the ratio of analyte signal to internal standard is recorded. Any inconsistency in injection of the sample will affect both the analyte and internal standard. Properties of the internal standard should include: a. The retention times of internal standard and analyte should be different and the two peaks must be well separated, R >1.25 b. The detector response factor for the analyte and the internal standard should be the same. Using internal standards can significantly improve precision to better than 1%. The Area Normalization Method This technique can also overcome the uncertainties associated with sample injections. In this method, complete elution of all components is necessary where areas of all eluted peaks are computed and calculated areas are corrected for detector response. The concentration of the analyte is thus the ratio of its corrected peak area to total corrected areas of all peaks. The method is not as versatile as the internal standard method.


