From www.bloodjournal.org by guest on March 5, 2016. For personal use only.
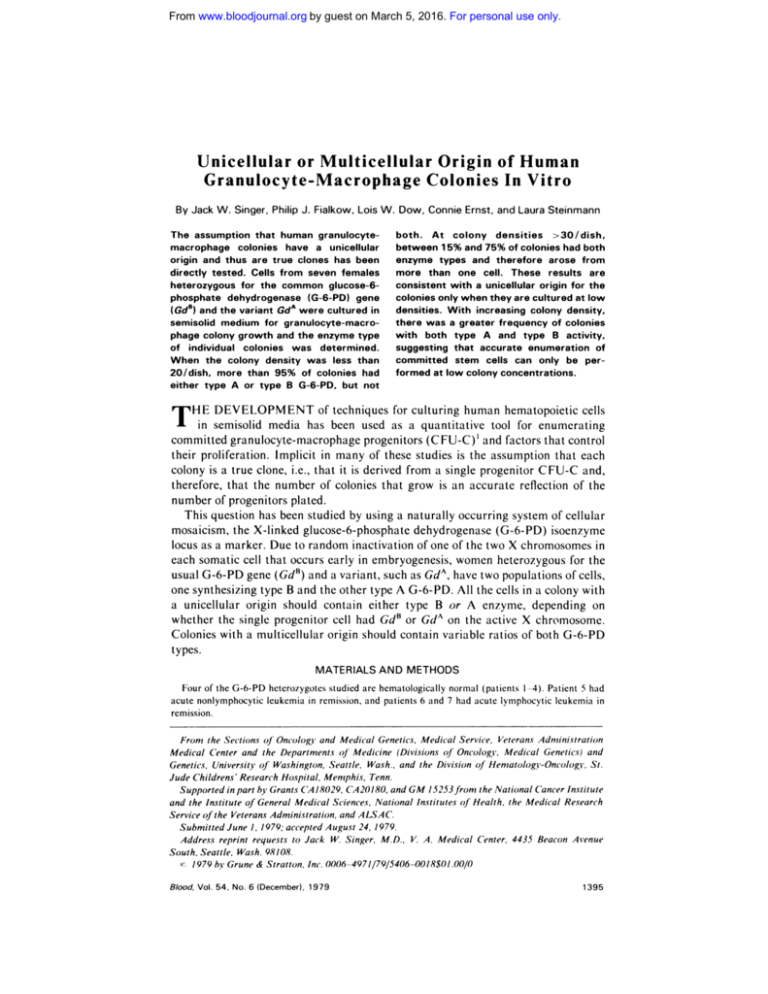
Unicellular
or Multicellular
Granulocyte-Macrophage
Jack
By
The
W.
Singer,
assumption
that
macrophage
origin
directly
thus
tested.
the
semisolid
of
medium
growth
individual
When
the
colony
20/dish.
more
T
type
density
or
been
females
therefore,
number
95%
type
type
determined.
of
less
than
colonies
B G-6-PD.
has
had
but
question
has
been
somatic
cell
that
was
both
with
of techniques
been
used
acute
of
the
type
A
stem
at low
results
are
cultured
studied
occurs
leukemia
density.
frequency
of colonies
and
B
cells
(CFU-C)1
that
by using
early
the
at low
colony
type
accurate
colony
are
for
activity.
enumeration
can
only
of
be
per-
concentrations.
for culturing
human
hematopoietic
cells
as a quantitative
tool for enumerating
grow
is an
a naturally
glucose-6-phosphate
to random
inactivation
and
factors
should
are
in remission,
control
that
CFU-C
each
and,
reflection
occurring
system
of the
of cellular
(G-6-PD)
isoenzyme
two X chromosomes
women
heterozygous
variable
in
for the
ratios
of both
G-6-PD
METHODS
hematologically
and
that
as GdA,
have two populations
of cells,
G-6-PD.
All the cells in a colony
with
type
B or A enzyme,
depending
on
or GdA on the active
X chromosome.
contain
AND
studied
accurate
dehydrogenase
of one of the
in embryogenesis,
origin
heterozygotes
nonlymphocytic
a greater
both
from
origin
increasing
committed
progenitors
a multicellular
G-6-PD
These
they
had
arose
in many
of these studies
is the assumption
that it is derived
from a single
progenitor
MATERIALS
Four
when
that
usual G-6-PD
gene (GdB) and a variant,
such
one synthesizing
type B and the other type A
a unicellular
origin
should
contain
either
whether
the single
progenitor
cell had GdB
Colonies
types.
cell.
suggesting
formed
therefore
a unicellular
With
with
>30/dish.
of colonies
not
number
of colonies
plated.
mosaicism,
the X-linked
locus as a marker.
Due
only
there
75%
one
with
densities.
Steinmann
densities
and
and
than
colonies
in
and Laura
colony
consistent
gene
enzyme
Implicit
clone,
i.e.,
that the
of progenitors
This
more
glucose-6-
granulocyte-macrophage
their proliferation.
colony
is a true
each
types
was
HE DEVELOPMENT
in semisolid
media
committed
enzyme
was
than
A
1 5%
has
At
Ernst,
both.
(G-6-PD)
colonies
Connie
between
seven
the
In Vitro
Dow,
unicellular
common
and
W.
Colonies
granulocyte-
GdA were
cultured
for granulocyte-macro-
variant
colony
either
from
the
Lois
of Human
a
clones
dehydrogenase
and
phage
true
Cells
for
phosphate
have
are
heterozygous
(GdB)
human
colonies
and
J. Fialkow,
Philip
Origin
patients
normal
6 and
7 had
(patients
acute
1-4).
Patient
lymphocytic
5 had
leukemia
in
remission.
Front
the Sections
Medical
Genetics.
of Oncology
and
and the Departments
Center
University
of
Washington.
Medical
of
Seattle.
Genetics,
Medicine
Wash.
Medical
(Divisions
,
Service,
of
Oncology.
and the Division
Veteran.s
Medical
Ad,ninistration
Genetics)
of Henzatologv-Oncologv.
and
St.
Jude Childrens’
Research Hospital,
Memphis.
Tenn.
Supported
in part by Grants
CA18029,
CA20180,
and GM 15253from
the National
Cancer Institute
and the Institute
of General
Medical
Sciences,
National
Institutes
of Health,
the Medical
Research
Service
ofthe
Veterans
Administration,
and ALSAC.
Submitted
June 1, /979; accepted
August
24, 1979.
Address reprint
requests
to Jack
W. Singer.
M.D.,
V. A. Medical
South, Seattle, Wash. 98108.
(c /979 lj;. Grune & Stratton,
Inc. 0006-4971/79/5406-00l8$01.00/0
Blood,
Vol.
54,
No.
6 (December),
1979
Center,
4435
Beacon
Avenue
1395
From www.bloodjournal.org by guest on March 5, 2016. For personal use only.
1396
SINGER
Peripheral
blood
separated.
The
was
cells
2-mercaptoethanol
relative
The
isoenzyme
density
salt
by freezing
EDTA.
of the
discontinuous
in preservative-free
lysed
and
activity
balanced
collected
were
and
cell
lysates
bands
gradients
was
(Teva,
solution
(Microbiological
growth,
between
heparin
thawing
were
U/ml)
The
Cells
interphase
and
buffy
cells
coat
8.0)
gel
electrophoresis
were
were
cells
containing
for culture
cells
the viable
the
(pH
to starch
visually.3’4
Jerusalem).
and
buffer
subjected
estimated
Associates)
(10
in Tris-HC1
ET AL.
and
were
washed
were
NADP,
the
separated
twice
enumerated
on
in Hank’s
by trypan-blue
dye exclusion.
For
colony
methyl
cellulose
Rockville,
(MCB)
Md.)
containing
conditioned
(PHA)
plastic
Petri
(Lux)
10 x
l0
were
Difco,
fetal
calf
(Reheis)
serum
One-milliliter
and
cells/ml
(Bactoagar;
20%
medium.5
dishes
and
agar
incubated
aliquots
for 14 days
plated
Detroit,
and
of this
in a mixture
Mich.)
in alpha
a plateau
dose
mixture
were
cell
at 37#{176}C
in a high
consisting
of 0.8%
medium
(Flow
Labs,
of phytohemagglutinin
plated
humidity,
in 10
x 35 mm
5% C02-95%
air,
tissue
incubator.
culture
The colonies
in each
electrophoresed
plucked
to
with
was
a fine
that
random
shown
were
colonies
cellulose
acetate
immediately
experiments,
and one control,
strip.
Lysis
subjected
it
was
of the
that
cells
and
the
then
G-6-PD
stained
type
of
not
those
rosettes
media
without
a
In
electrophoresed
with
sheep
GdB
male,
dry
G-6-PD
activity.4
as
small
as
20
were
erythrocytes.
with
clusters
colonies
in the dishes.
by freezing
for
were
to pluck
activity
from a normal
achieved
Colonies
taken
to
to form
individually
then
of supporting
appearance
not
was
and
of background
type B colony grown
colony
to electrophoresis
determined
in
and
was
A sample
amount
similar
for peroxidase
40x
methods.
Care
colonies.
the
at
published
microscope.
to other
colonies
positively
microscope
previously
to determine
individual
to stain
experimental
on each
run
inverted
by
a dissecting
adjacent
on each
an
type
with
closely
were
with
G-6-PD
pipette
electrophoresed
and
counted
the
capillary
each experiment,
plucked
were
plate
determine
for electrophoresis
colony
Two
0.5
or 0.3%
placed
were
ice.
The
strips
In preliminary
cells
could
be
determined.
RESULTS
The
ratio
of A:B
G-6-PD
activity
in red cells,
buffy
coat
cells,
or skin
the heterozygotes
are shown
in Table
1 , as well as the G-6-PD
of individual
granulocytic
colonies
and the number
of colonies
from
types
each
dish.
When
the
number
showed
only one
lence
of colonies
enzyme
with
Spearman’s
order
rank
of colonies
per dish
type, but as colony
a double
isoenzyme
correlation
low,
concentrations
type
rose
coefficient).
Table
was
The
almost
fibroblasts
isoenzyme
harvested
increased,
0.001;
(p
the
r
<
morphology
in
all of the colonies
of each
=
preva0.92;
colony
was
1.
A:B Ratio of
G-6-PD
G-6-PD
Buffy
No.
RBC
Coat
Cells
1
1:1
1:1
Patient
Colonies/Dish
PB
-
A
8±2t
Marrow
64
6
±
Colonies
B
AB
5
6
0
% AB
0
16
5
11
34
13
2:3
1:1
-
PB
12±2
20
1
4
3
5:1
5:1
-
PB
2±1
4
1
0
0
4
2:3
1:1
-
PB
9 ± 2
13
14
1
4
6
7
2
13
0
3
9
75
5
-
6
7
hematologically
study.
Sample
Skin
of Individual
2
2:1
3:1
-
1:1
1:1
Marrow
110±12
-
1:1
1:1
Marrow
(SeeFig.2)
A:B ratio of G-6-PD
are
Type
Granulocyte
Patients
tMean
Studies
±
isoenzyme
normal.
activity
Patient
6 and 7 had acute
5 had
55±3
PB
(SeeFig.
in cells from 7 G-6-PD
acute
lymphocytic
1 standard
deviation.
on this patient
have been
PB
published
nonlymphocytic
leukemia
1)
heterozygotes
leukemia
in remission.
treated
in complete
directly.
remission
Patients
at the
1-4
time
of
From www.bloodjournal.org by guest on March 5, 2016. For personal use only.
CELLULAR
ORIGINS
OF
COLONIES
1397
3C
Fig. 1 .
The effe
of increasing
granulocytic
colony
density
on the frequency
of A/B
colonies
grown
from
peripheral
blood mononuclear
cells from patient
4.
The
solid
line indicates
the
observed
number
of colonies/dish
at each plating
density.
and
the
the frequency
B type G-6-PD
described
hatched
line
of colonies
activity.
S
2C
20
,,,-“
both
I0
,,,,-“
#{176}
,,,,,-“
,#
.“
,,,“
A and
0.1
0.2
CELLS
at the time
of plucking
,,“
,,.,.‘-‘‘
IC
indicates
with
,‘#{176}
for electrophoresis,
and
.r’
I
0.5
.0
PLATED
t
o
&
106
no differences
were
noted
between
colonies
giving
rise to both
isoenzyme
types
and those
with
a single
isoenzyme
type. Even at high cell densities,
electrophoresis
of supporting
material
without
a colony
demonstrated
no measurable
G-6-PD
activity.
Figure
1 shows
a dose-response
curve
with cells
from
patient
4 cultured
in
methylcellulose
and the frequency
of colonies
that typed
as A/B at each point.
No
colony
29/dish,
from
had a double-enzyme
4 of 23 ( 1 7%) typed
marrow
cells
from
phenotype
at densities
as A/ B. Figure
2 shows
patient
7 cultured
in agar.
of < I 2/dish.
However,
at
a similar
set of curves
derived
At colony
densities
<25/dish,
all colonies
typed as either
A or B, whereas
when there were 60 or more colonies
per
dish, colonies
with more than a single cell origin
were found.
The visual
estimation
of the amount
of enzyme
per colony
correlated
not with
cell number
but with an estimation
of the macrophage
content
of colonies.
Mixed
granulocyte-macrophage
colonies
containing
as few as 20 macrophages
often
contained
cytes.
typed
more
All colonies
as B.
activity
than
compact
analyzed
in the
colonies
cultures
containing
grown
several
from
the
hundred
white
male
granulocontrols
DISCUSSION
Although
granulocyte
previously
unicellular
al.,7 who
it is assumed
colony
grown
been
reported.
on the basis
of indirect
evidence
that
each
in vitro arises
from a single
cell, formal
proof
The
best
evidence
supporting
the hypothesis
origin
for granulocyte-macrophage
micromanipulated
single
cells
from
colonies
was
monkey
marrow
human
has not
of a
reported
by Moore
et
and found that they
15
B
I
C,)
z
m
,,-
U)
10
-
Fig. 2.
granulocytic
8
0
0
CELLS
PLATED
x 106
The effect
of increasing
colony
density
on the
frequency
of A/B colonies
grown from
marrow
from patient
7. The solid line
indicates
the
observed
number
of
colonies/dish
at each plating
density.
and the hatched
line indicates
the
frequency
of colonies
with both A and
B type G-6-PD
activity.
From www.bloodjournal.org by guest on March 5, 2016. For personal use only.
1398
SINGER
formed
granulocyte-macrophage
in a murine
system,
demonstrated
colonies.
a linear
colonies
versus
the numbers
from an individual
cell.
To formally
macrophage
grown
from
determine
of cells
test the hypothesis
colonies,
we have
G-6-PD
the
colonies
from
G-6-PD
and
from
two
subjects
cells,
An
be expected
results
most
CFU-C.
The
presence
colony
density
these
A/B
arose
colonies
from
colonies
colonies
numbers
17%
the
arose
from two or more spatially
arise from at least two progenitors,
were
A/B;
the
least 34%.
If the relationship
frequency
between
the
both
number
used
previously
to
to show
the
aspects
cells.
The
of cell
granulocytic
type
A or type
colonies
isoenzyme
A and
B type
types
colonies
present
B
arose
on
would
electrophoretic
from
these predictions
colonies
from
and are
a single
with
both
types
as
some
of
assumption
isoenzyme
that
at
least
closely
related
progenitors.
Since
the actual
frequency
of colonies
is more
than
double
Even
if all colonies
type. Thus,
in patient
of colonies
arose
arise,8’9
either
had
of colonies
arising
from
more
than
a single
cell
colonies
from balanced
heterozygotes.
50% would
still have a single
enzyme
dish,
have
more
with
colony
If granulocyte
are clearly
different
of granulocyte/macrophage
is consistent
been
contain
of mixed
or
each
colonies6
and to study
myelogenous
leukemia.”
sufficiently
low density,
should
three
has
neoplasms
progenitors.
frequency
of increasing
increases
single
that
origin
of human
granulocytetype of individual
colonies
human
for G-6-PD
greater
colony
densities
with
origin
suggested
mosaicism
which
erythroid
and chronic
plated
at
from
of the
even
if they
at low
consistent
human
vera’0
when
arise
50%
electrophoresis.
from
heterozygous
therefore
and
G-6-PD
of cells
clonal
origin
of day 8-13
regulation
in polycythemia
The data
indicate
that
plated
AL.
studies,
Bradley
and Metcalf,’
line for the numbers
of murine
of the unicellular
studied
the isoenzyme
heterozygotes.
number
In earlier
regression
ET
with
the incidence
of A/B
had a two-cell
origin,
4, at 29 colonies/per
a multicellular
of CFU-C
plated
origin
and
the
was
number
at
of
colonies
produced
is a simple
one, the G-6-PD
data predict
that it should
be linear
only at colony
densities
up to approximately
30/dish.
At higher
densities,
due to the
increasing
frequency
of colonies
with a multicellular
origin,
a dose-response
curve
with a continuously
decreasing
slope would
be expected.
However,
in contrast
to
this prediction,
the dose-response
relationships
are linear
up to 160 colonies/dish
(Fig.
2). Therefore,
of colonies
that
for the greater
the
relationship
between
number
of CFU-C
grow out is not simple
at higher
cell densities.
than
expected
number
of colonies
include
plated
Possible
cell-cell
and
number
explanations
interaction
resulting
either
in increased
proliferative
potential
they produce
colonies,
or recruitment
of additional
of cluster-forming
cells so that
cells into the CFU-C
compart-
ment.
resulting
Insofar
interactions
as
the
is cell-density
putative
increased
dependent,
growth
the
dose-response
from
relationship
direct
cell-cell
should
be
nonlinear
with a continuously
increasing
slope.
However,
this response
was not
observed,
probably
due to the increasing
number
of colonies
with a multicellular
origin.
Therefore,
the observed
linear cell dose-response
curve may be complex
and
the result
of the summation
of two opposite
nonlinear
phenomena.
Two conclusions
drawn
from these
data
are: ( 1 ) The majority
of granulocytemacrophage
colonies
can be assumed
confidently
to have a unicellular
origin only if
plated
at a cell density
low enough
to yield
30 or fewer
colonies
per dish;
(2)
From www.bloodjournal.org by guest on March 5, 2016. For personal use only.
CELLULAR
ORIGINS
OF
accurate
enumeration
COLONIES
1399
of CFU-C
density.
The multicellular
of the number
of committed
and the underestimation
cultures
with more than
have a unicellular
origin.
dose-response
curve
only
when
cells
are plated
causes
significant
concentrations
at low
underestimation
as low as 30/dish,
be performed,
and
the
absolute
CFU-C
concentration
dishes
with fewer
than
30 colonies.
Only
then
can it be
arise
from single
progenitors.
However,
even under
these
of the lack of stimulatory
cell-cell
interactions,
all potential
CFU-C
may not form colonies.
Typing
colonies
from G-6-PD
establishing
performed
increases
substantially
as the colony
density
increases.
In
100 colonies/dish,
few if any colonies
can be assumed
to
Therefore,
for accurate
enumeration
of CFU-C,
a cell
should
calculated
from
those
assumed
that colonies
circumstances
because
is best
origin
of the colonies
stem cells at colony
whether
or
heterozygotes
not
other
types
also
should
of in vitro
be helpful
colonies
in definitively
such
as the
“mixed
cell”2
and T-cell
colonies’3”4
arise
from
single
progenitors.
The present
study
demonstrates
some of the pitfalls
of assuming
a unicellular
origin
for colonies,
even
when they are at relatively
low densities
and appear
to have a linear
cell-dose
to
colony-number
relationship.
ACKNOWLEDGMENT
We wish to thank
Drs.
1 . Bradley
Metcalf
John
Moohr
and
Roger
Berkow
for providing
samples
on patient
5.
REFERENCES
mouse
Med
TR,
bone
marrow
cells
1966
Metcalf
Hemopoietic
2.
D:
of Normal
Springer-Verlag,
3.
and
1977
Fialkow
linear
PJ:
Genet
4.
cell
pool
cell
MC,
to
I 978
and
Ann
DE:
human
Lab
Clin
Lau
McCulloch
EA,
Till
of hemopoietic
JE,
Price
growth
leukocytes.
Exp
GB:
factors
Hematol
by
6:1 14,
1978
6.
Fialkow
vitro:
89:489,
7.
fication
forming
Physiol
8.
Biochim
9.
blood
press)
iF,
Adamson
PJ: Human
Evidence
JW,
erythroid
for
clonal
Steinmann
colony
origin.
formation
I 1 . Singer
J Cell
Moore
and
MAS,
Williams
N,
characterization
cell
in monkey
79:283,
Metcalf
committed
53:264,
1979
12.
Fauser
of the
hemopoietic
in vitro
13.
Pi: Clonal
Biophys
Acta
Fialkow
Pi:
cell
neoplasms.
Clonal
458:283,
and
Contemp
of human
tumors.
1976
stem
cell
origin
Hematol
of
(in
cord
L,
WA:
Chronic
to detect
residual
in
vitro.
HA:
Blood
Granulo-
human
bone
marrow,
blood.
Blood
52:1243,
LA,
in soft
D, Kalechman
PHA-stimulated
agar
MH,
Y:
human
culture.
Rodger
5, Metcalf
T lymphocytes
Immunol
Immunology
28:526,
Fialkow
MB,
Johnson
D: Colony
in agar
GR,
formation
medium.
Clin
by
Exp
1977
PJ,
Singer
Berkow
RL,
Friedman
Moohr
JW:
Acute
iW,
iM,
Adamson
Jacobson
Expression
in cells
differentiation.
restricted
JW,
Ri,
nonlymphocytic
monocytic
1979
Shoham
of
1975
human
15.
origin
and
proliferation
14. Claesson
1972
Fialkow
in
61:1044,
Steinmann
cells
Messner
Rozenszajn
Whittingham
J Cell
Failure
in
cell
I 978
29:1041,
colony
tissue.
PJ,
AA,
The
stem
Invest
Robinson
colonies
5, Stein-
vera.
Clin
stem
blood
peripheral
Murphy
abnormal
Fialkow
SF,
leukemia:
normal
lymphocytes
D: Pun-
and
J
Stein
myelocytic
in
Physiol
iW,
Polycythemia
JW,
V,
L,
1976
Pi:
erythropoietin.
Najfeld
Clonal
Prchal
Adamson
of normal
erythropoietic
1969
PHA-stimulated
lines
Berlin,
Townsend
of
iF,
In Vitro
size
i
Prchal
L, Fialkow
response
types.
dehydrogenase.
10.
mann
vitro
Cells.
electrophoresis
73:531,
production
Biol
Colonies:
Baluda
acetate
L,
i Exp
1973
glucose-6-phosphate
5.
of
Aust
of five human
RS,
Cellulose
growth
pp 57-98
37:39,
Sparkes
The
Leukemic
Primordial
relationships
Human
The
in vitro.
Sci 44:287,
Cloning
Med
D:
to granulocytic
N
EngI
and
leukemia:
i
Med
and
301 :1,
From www.bloodjournal.org by guest on March 5, 2016. For personal use only.
1979 54: 1395-1399
Unicellular or multicellular origin of human granulocyte-macrophage
colonies in vitro
JW Singer, PJ Fialkow, LW Dow, C Ernst and L Steinmann
Updated information and services can be found at:
http://www.bloodjournal.org/content/54/6/1395.full.html
Articles on similar topics can be found in the following Blood collections
Information about reproducing this article in parts or in its entirety may be found online at:
http://www.bloodjournal.org/site/misc/rights.xhtml#repub_requests
Information about ordering reprints may be found online at:
http://www.bloodjournal.org/site/misc/rights.xhtml#reprints
Information about subscriptions and ASH membership may be found online at:
http://www.bloodjournal.org/site/subscriptions/index.xhtml
Blood (print ISSN 0006-4971, online ISSN 1528-0020), is published weekly by the American Society of
Hematology, 2021 L St, NW, Suite 900, Washington DC 20036.
Copyright 2011 by The American Society of Hematology; all rights reserved.

