Failure Mode and Effect Analysis FMEA Checklist
advertisement
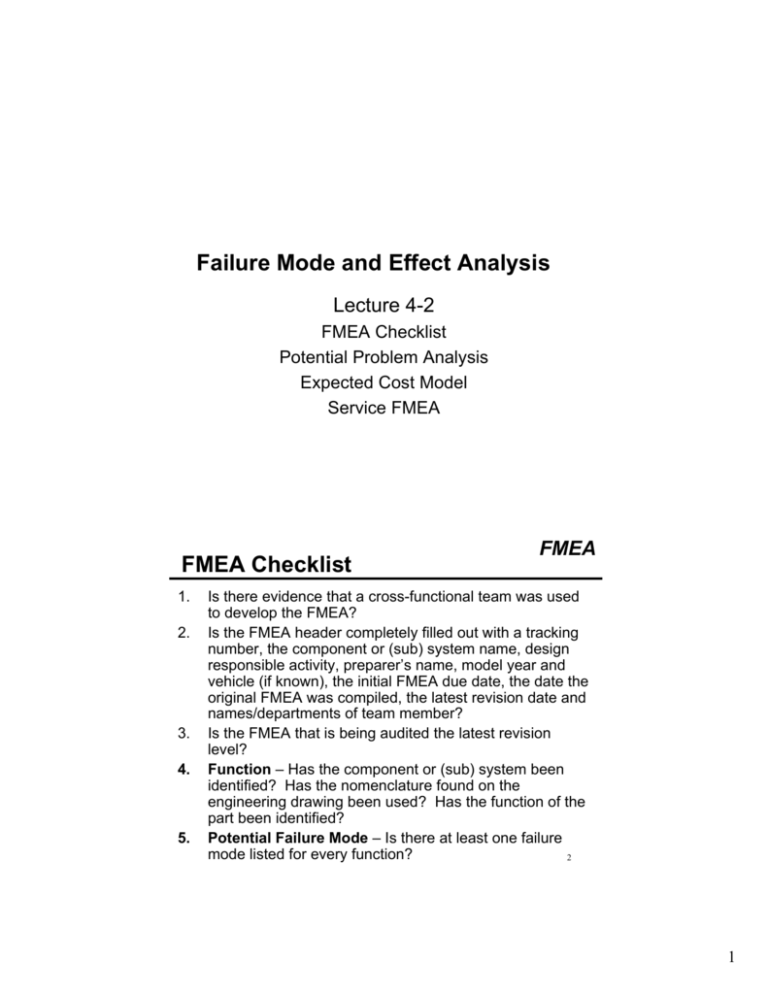
Failure Mode and Effect Analysis Lecture 4-2 FMEA Checklist Potential Problem Analysis Expected Cost Model Service FMEA FMEA Checklist 1. 2. 3. 4. 5. FMEA Is there evidence that a cross-functional team was used to develop the FMEA? Is the FMEA header completely filled out with a tracking number, the component or (sub) system name, design responsible activity, preparer’s name, model year and vehicle (if known), the initial FMEA due date, the date the original FMEA was compiled, the latest revision date and names/departments of team member? Is the FMEA that is being audited the latest revision level? Function – Has the component or (sub) system been identified? Has the nomenclature found on the engineering drawing been used? Has the function of the part been identified? Potential Failure Mode – Is there at least one failure mode listed for every function? 2 1 FMEA Checklist FMEA 6. Potential Effects of Failure – Are the effects of the failure defined and are they defined in terms of what the internal or vehicle level external customer might notice? 7. Severity – Is the severity (or seriousness) of the potential effect of the failure rated? (See Definitions provided above.) 8. Classification – Are the significant and critical characteristics identified in this column? (blanks are allowed) (See Special Characteristics model on other side) 9. Potential Causes/Mechanisms of Failure – Is there at least one potential cause of failure listed for every failure mode? 10. Occurrence – has an occurrence ranking been assigned to each of the potential causes/mechanisms of failure? (See Definitions provided above.) 3 FMEA Checklist FMEA 11. Current Design Controls – Is there listed a prevention, design validation/verification (DV) or other activities which will maximize design adequacy of the failure mode and or cause mechanism? 12. Detection – Is there a detection ranking that assesses the ability of the design controls to detect a potential cause/mechanism or the ability of the design controls to detect the subsequent failure mode before the component or (sub) system is released for production. (See Definitions provided above.) 13. RPN – Has the RPN been calculated by multiplying S x O x D? 14. Recommended Actions – Have actions been identified for potential significant and critical characteristics and to lower the risk of the higher RPN failure modes? Has “none” been entered in the column if no actions are recommended? 4 2 FMEA Checklist FMEA 15. Responsibility – Has an individual, SBU and target completion date been entered in columns where an action has been recommended? (Blanks are OK when no action is recommended) 16. Actions Taken – Has a brief description of the actual action and effective date been entered after the action has been taken? (Blanks are OK when no action is recommended) 17. Resulting severity, occurrence, detection and RPN – Have the new severity, occurrence, detection and RPN numbers been entered after an action has been completed and verified? 18. Has the design responsible engineer implemented or adequately addressed the recommended action? 5 FMEA FMEA for Business Processes Plan Analysis Potential Problem Analysis 6 3 FMEA Potential Problem Analysis - Definition • Potential Process Analysis is a systematic process for uncovering and dealing with potential problems that are reasonably likely to occur and therefore worthy of attention PPA can be applied to a project plan or to a business process to determine areas of potential problem and risk. The New Rational Manager, Charles Kepner, Benjamin Tregoe, Princeton Research Press, 1981 FMEA Form PLAN ANALYSIS - POTENTIAL PROBLEMS PLAN/ACTIONS /TASKS 7 POTENTIAL PROBLEMS EFFECTS LIKELY CAUSES SEV OCC ACTIVITY: PREVENTIVE ACTIONS CONTINGENT ACTIONS TRIGGERS FOR CONTINGENT 8 4 Identifying the Vulnerable Areas FMEA What areas, tasks or steps are most likely to: • Provide problems that could disorganize, disrupt or otherwise seriously jeopardize the smooth operation of the activity? • Allow defects or escape to the customer? What are some examples of where to look for vulnerable areas? 9 Identifying Likely Causes FMEA And Preventive Actions Effect of a preventive action: remove, partially or totally, the likely cause of a potential problem Effect of a contingent action: reduce the impact of a problem that cannot be prevented 10 5 FMEA PPA Steps ACTIVITY: PLAN ANALYSIS - POTENTIAL PROBLEMS PLAN/ACTIONS /TASKS POTENTIAL PROBLEMS EFFECTS LIKELY CAUSES This is a chronological list of tasks or project steps showing the risk (vulnerable) areas. A risk area is: - anything never done before - overlapping responsibility or authority - tight deadlines - activities carried out at long distance. S E V O C C PREVENTIVE ACTIONS CONTINGENT ACTIONS This column most likely to go wrong within the area of risk. Anticipates possible deviations from intended target. Ask what should happen and then what could happen or go wrong. Be specific but avoid in-depth explanation. describes the WHAT, WHERE, WHEN and EXTENT of individual items and timing for each step in plan 11 FMEA PPA Steps ACTIVITY: PLAN ANALYSIS - POTENTIAL PROBLEMS PLAN/ACTIONS /TASKS POTENTIAL PROBLEMS TRIGGERS FOR CONTINGENT ACTION EFFECTS LIKELY CAUSES This is what the customer of end user sees as symptoms. It is the consequence of the failure on the next process, operation, product, customer, etc. Answers "What does the customer experience as a result of the problem?" S E V O C C PREVENTIVE ACTIONS CONTINGENT ACTIONS TRIGGERS FOR CONTINGENT ACTION Identify factors which could create or cause the anticipated problem. Use imagination, experience, and logic to help you determine likely causes. Additional tools such as causeeffect diagram or affinity diagram may be helpful in isolating causes. Several causes may exist for each potential problem. 12 6 FMEA PPA Steps ACTIVITY: PLAN ANALYSIS - POTENTIAL PROBLEMS PLAN/ACTIONS /TASKS POTENTIAL PROBLEMS EFFECTS LIKELY CAUSES S E V O C C PREVENTIVE ACTIONS CONTINGENT ACTIONS TRIGGERS FOR CONTINGENT ACTION Assess threat in terms of severity and likelihood, or occurrence. Preventive actions work on the CAUSES. Use HIGH, MED or LOW. Determine ways to keep likely causes from creating potential problems. List previous actions which are feasible, and practical. A preventive action can address one or more causes. 13 FMEA PPA Steps ACTIVITY: PLAN ANALYSIS - POTENTIAL PROBLEMS PLAN/ACTIONS /TASKS POTENTIAL PROBLEMS EFFECTS LIKELY CAUSES Contingent actions reduce likely EFFECTS. They are to minimize the impact of a potential problem should it occur. S E V O C C PREVENTIVE ACTIONS CONTINGENT ACTIONS TRIGGERS FOR CONTINGENT ACTION Establishes a feedback that indicates that a potential problem has occurred. Its purpose is to activate a contingent action. Triggers should be automatic if possible and include: - how the problem will be spotted - how the contingent action will be set in motion. 14 7 When to Use PPA FMEA • PPA is a simplified version of FMEA suitable for business processes or task analysis • Use PPA whenever experience and gut feeling say that something could go wrong in the future. • PPA enables a person to make full use of his or her experience. Merely being able to remember a thousand horror stories is of no use unless that body of information can be used to prevent more Kepner-Tregoe 15 FMEA Expected Cost Model 16 8 Expected Cost Model FMEA • Overcomes the limitations and ad hoc nature of RPN – In itself, RPN is meaningless – Components of RPN (Severity, Occurrence and Detection) are based on different scales – RPN’s are not additive - cannot get an overall assessment – RPN is not economically-based – RPN is not volume-based 17 Expected Cost Model FMEA pf = probability of a fault pd = probability that it escapes detection assuming that pf and pd are independent, the probability that the customer receives the defect is = pf X pd These probabilities can be estimated from: – production records – customer records – sample inspection results 18 9 FMEA Expected Cost Model • Estimate cost per fault C • Start with rough estimate based on – Internal scrap, rework – Warranty costs – Other Cost-Of-Poor-Quality factors • If n items are produced (yearly, monthly) • Expected cost of escapes: EC = Cnpf pd 19 FMEA Estimating Occurrence Fault Occurrence Dent Probability 5/10 1/10 5/100 1/100 5/1000 1/1000 5/10,000 1/10,000 5/100,000 1/100,000 5/1,000,000 1/1,000,000 0.5 0.1 0.05 0.01 0.005 0.001 0.0005 0.0001 0.00005 0.00001 0.000005 0.000001 Split Blemish X X X 20 10 FMEA Estimating Undetection Undetection (escape) Dent Probability 10/10 8/10 6/10 3/10 1/10 5/100 1/100 5/1000 1/1000 1/10,000 Split Blemish X X X 21 Total Cost Comparison FMEA Costs Failure Mode Cost per Item 30 Dent 100 Split 10 Blemish Month Volume 100,000 50,000 100,000 Probabilities Occurrence Detection 0.01 0.1 0.0005 0.05 0.001 0.005 Total Cost Expected Cost $3,000 $125 $5 $3,130 22 11 FMEA Applications 23 Service FMEA FMEA Goal/purpose/objective - define demonstrate, and maximize solutions in response to – – – – – quality, reliability, maintainability, cost and productivity Must be based on solid needs, wants, and expectations of the customer as defined by the – Design specifications – Customer 24 12 Electromechanical FMEA • Component failures typically affect performance adversely • Usually based on specific component or subassembly level where basic failure criteria is known or can be obtained • Focus on the relationship between element failures and . . . – system failures – operational constraints, margins – degradation of performance integrity 25 FMEA • Important technique for reliability assurance • Inductive method of performing a qualitative system review or safety analysis from low level to high level • Often applied within context of specific projects • FMEA identified priorities for process controls, inspection and tests 26 13 FMEA FMEA helps establish the need for: • redundancy • design features which increase probability of fail-safe outcomes of failures • derating of design simplification • alternative materials, suppliers • design reviews • ability of test program to catch potential failures • data recording and monitoring 27 FMEA Preparatory Steps • Define the system • Develop functional and reliability block diagrams – Break the system into major subsystems – Have a clear understanding of the inputs and outputs of each subsystem – Understand redundancies and features that provide fail-safe measures 28 14 FMEA and ISO/QS 9000 FMEA Requirement of QS 9000 ISO 9001-1994, paragraph 4.4.1 states: • The supplier shall establish and maintain procedures to control and verify the design of the product in order to ensure that the specified requirements are met. Paragraph 4.4.2 states: • The supplier shall draw up plans that identify the responsibility for each design and development activity. The plans shall describe or reference these activities and shall be updated as the design evolves.... The design and verification activities shall be planned and assigned to qualified staff equipped with adequate resources. 29 FMEA and ISO/QS 9000 FMEA Paragraph 4.4.3 states: • Organizational and technical interfaces between different groups shall be identified and the necessary information documented, transmitted and regularly reviewed. • Also, paragraph 4.4.4 that design requirements and their selection be reviewed and crucial design characteristics identified. Paragraphs 4.9 and 4.14 require appropriate proof of documentation in both process control and corrective / preventive action. FMEA meets the intent and the spirit of the prevention mood of the entire ISO 9000 standard. It is a tool for optimizing the system, design, and process by modifying, improving or eliminating known or potential failure modes. 30 15
