Earthquake Epicenter Lab: Finding Epicenters
advertisement
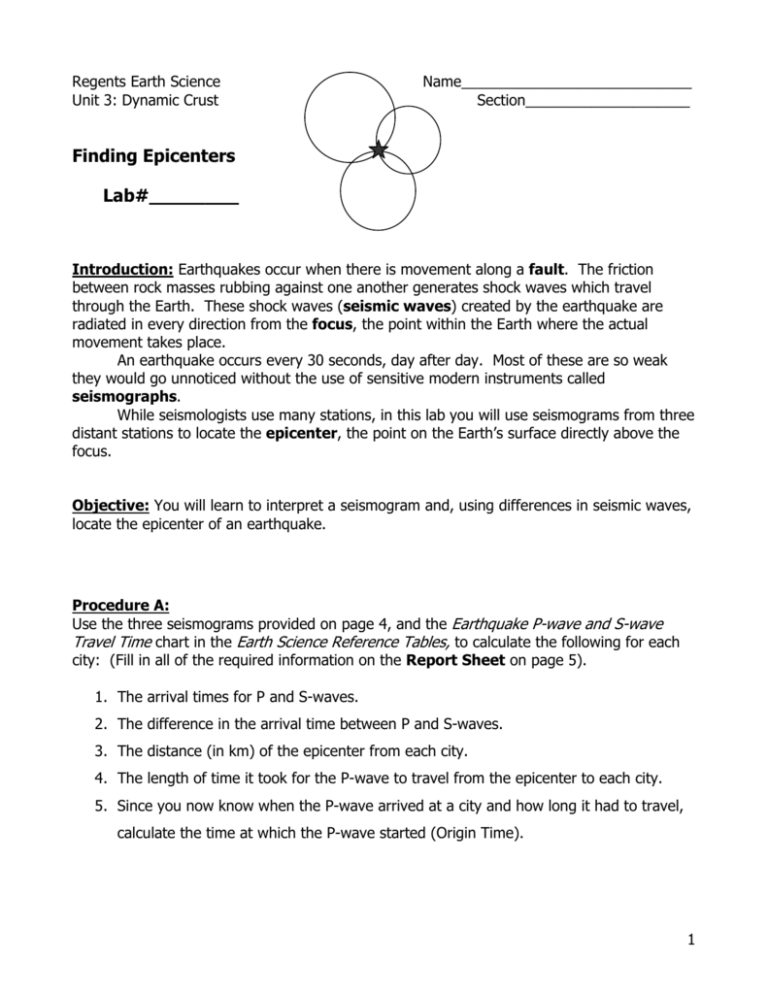
Regents Earth Science Unit 3: Dynamic Crust Name____________________________ Section____________________ Finding Epicenters Lab#________ Introduction: Earthquakes occur when there is movement along a fault. The friction between rock masses rubbing against one another generates shock waves which travel through the Earth. These shock waves (seismic waves) created by the earthquake are radiated in every direction from the focus, the point within the Earth where the actual movement takes place. An earthquake occurs every 30 seconds, day after day. Most of these are so weak they would go unnoticed without the use of sensitive modern instruments called seismographs. While seismologists use many stations, in this lab you will use seismograms from three distant stations to locate the epicenter, the point on the Earth’s surface directly above the focus. Objective: You will learn to interpret a seismogram and, using differences in seismic waves, locate the epicenter of an earthquake. Procedure A: Use the three seismograms provided on page 4, and the Earthquake P-wave and S-wave Travel Time chart in the Earth Science Reference Tables, to calculate the following for each city: (Fill in all of the required information on the Report Sheet on page 5). 1. The arrival times for P and S-waves. 2. The difference in the arrival time between P and S-waves. 3. The distance (in km) of the epicenter from each city. 4. The length of time it took for the P-wave to travel from the epicenter to each city. 5. Since you now know when the P-wave arrived at a city and how long it had to travel, calculate the time at which the P-wave started (Origin Time). 1 Procedure B: 1. a. Find the Epicenter Location Map on page 6. To locate the epicenter on the map, for each city construct a circle whose radius is equal to the distance from the city to the epicenter. b. Use the scale of distance of your map to set the drawing compass at the correct radius. 2. Mark and label the epicenter on the map where all three circles intersect. 3. Answer the Analysis and Conclusion Questions. REMINDER: HOW TO USE THE EARTHQUAKE P-WAVE AND S-WAVE TRAVEL TIME CHART Analysis and Conclusion Questions: 1. How do P-waves and S-waves differ? 2. What was the approximate location of the epicenter of this earthquake? 2 The cross section of Earth below shows a P-wave moving away from an earthquake epicenter to seismic station A. 3. No S-waves arrive directly at seismic station A because (1) some parts of the core are liquid (2) S-waves travel too slowly (3) the distance to seismic station A is too great (4) seismic station A is located on glacial ice 3 Base your answers to questions 4 and 5 on the diagrams below. Diagram 1 represents a cross section of Earth and its interior layers. The asterisk (∗ ) shows the location of an earthquake epicenter. Letters A through D are seismic stations on Earth’s surface. Diagram 2 shows four seismograms labeled I, II, III, and IV, which were recorded at seismic stations A, B, C, and D during the same time interval. 4. Which list correctly matches the seismograms with the seismic stations where they were recorded? (1) seismogram I – station A seismogram II – station B seismogram III – station C seismogram IV – station D (3) seismogram I – station C seismogram II – station B seismogram III – station D seismogram IV – station A (2) seismogram I – station B seismogram II – station D seismogram III – station A seismogram IV – station C (4) seismogram I – station A seismogram II – station D seismogram III – station B seismogram IV – station C 5. Station D is 8000 kilometers from the earthquake epicenter. How long did it take for the first P-wave to travel from the epicenter to station D? (1) 9 minutes 20 seconds (2) 11 minutes 20 seconds (3) 20 minutes 40 seconds (4) 4 minutes 20 seconds 4 6. The distance from Albany, New York, to the epicenter of an earthquake is 5600 km. Approximately how much longer did it take for the S-wave to arrive at Albany than the P-wave? (1) 4 minutes and 20 seconds (2) 7 minutes and 10 seconds (3) 9 minutes and 0 seconds (4) 16 minutes and 10 seconds Base your answers to questions 7 through 10 on the map below, which shows a portion of southwestern United States. On January 17, 1994, an earthquake occurred with an epicenter at Northridge, California. 7. State the latitude and longitude of Northridge, California. Include the correct units and compass directions in your answer. 8. Explain why earthquakes are common in this region of California. 9. Of the cities shown on the map, explain why Oakland was the last city to receive P-waves from this earthquake. 10. List two actions that a homeowner could take to prepare the home or family for the next earthquake. 5 REPORT SHEET SEISMOGRAPH STATION Arrival (clock times) P-wave Difference in Arrival Time (min. and sec.) Distance to P-wave Travel Epicenter Time (km) (min. and sec.) Time of Origin (hr., min. and sec.) S-wave CHICAGO TAMPA WINK 6 7 8
