University of California, Davis
advertisement

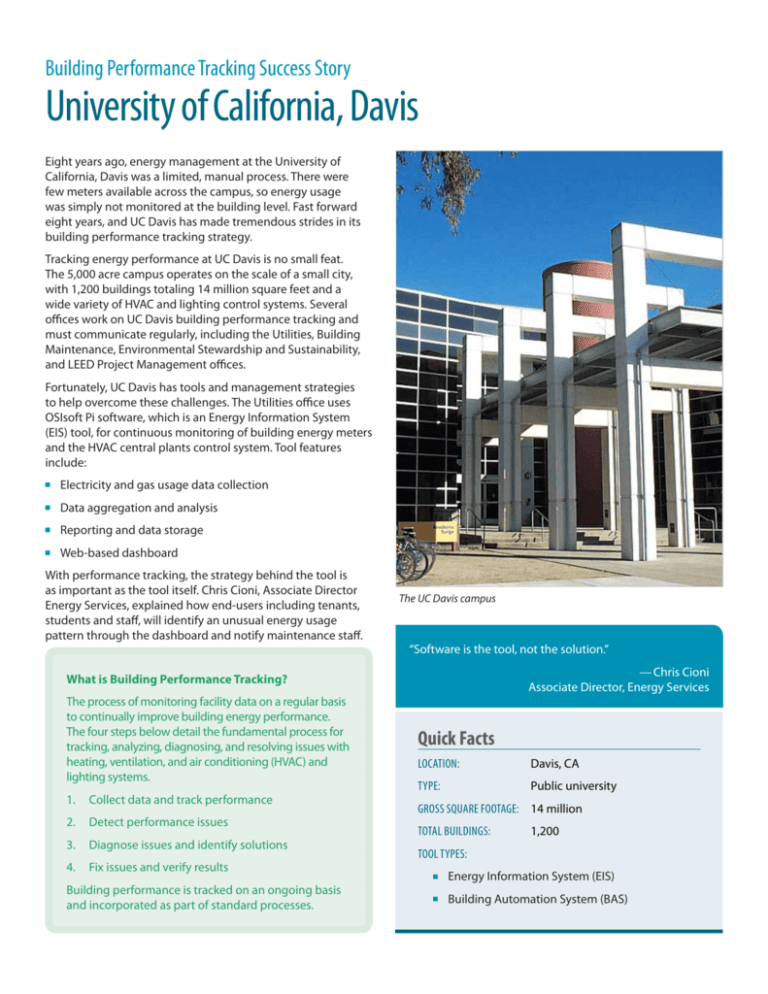
Building Performance Tracking Success Story University of California, Davis Eight years ago, energy management at the University of California, Davis was a limited, manual process. There were few meters available across the campus, so energy usage was simply not monitored at the building level. Fast forward eight years, and UC Davis has made tremendous strides in its building performance tracking strategy. Tracking energy performance at UC Davis is no small feat. The 5,000 acre campus operates on the scale of a small city, with 1,200 buildings totaling 14 million square feet and a wide variety of HVAC and lighting control systems. Several offices work on UC Davis building performance tracking and must communicate regularly, including the Utilities, Building Maintenance, Environmental Stewardship and Sustainability, and LEED Project Management offices. Fortunately, UC Davis has tools and management strategies to help overcome these challenges. The Utilities office uses OSIsoft Pi software, which is an Energy Information System (EIS) tool, for continuous monitoring of building energy meters and the HVAC central plants control system. Tool features include: ■■ Electricity and gas usage data collection ■■ Data aggregation and analysis ■■ Reporting and data storage ■■ Web-based dashboard With performance tracking, the strategy behind the tool is as important as the tool itself. Chris Cioni, Associate Director Energy Services, explained how end-users including tenants, students and staff, will identify an unusual energy usage pattern through the dashboard and notify maintenance staff. The UC Davis campus “Software is the tool, not the solution.” — Chris Cioni Associate Director, Energy Services What is Building Performance Tracking? The process of monitoring facility data on a regular basis to continually improve building energy performance. The four steps below detail the fundamental process for tracking, analyzing, diagnosing, and resolving issues with heating, ventilation, and air conditioning (HVAC) and lighting systems. 1. Collect data and track performance 2. Detect performance issues 3. Diagnose issues and identify solutions 4. Fix issues and verify results Building performance is tracked on an ongoing basis and incorporated as part of standard processes. Quick Facts Location: Davis, CA Type: Public university Gross square footage: 14 million Total buildings:1,200 Tool types: ■■ Energy Information System (EIS) ■■ Building Automation System (BAS) End-user access is a strategy that spreads the responsibility of monitoring building performance. Building Performance Tracking 101 UC Davis’ performance tracking has resulted in significant benefits, as seen in two key instances: ■■ ■■ Elements of a supportive working environment: ■■ Staff noticed a spike in student housing natural gas consumption, which they quickly attributed to a gas leak in the laundry space. Fixing the leak avoided a major safety issue and produced immediate gas savings. ■■ ■■ UC Davis measured and verified energy savings through Pacific Gas & Electric’s Monitoring-Based Commissioning program, allowing them to claim full rebates. ■■ ■■ Across campus, the Building Maintenance group is proving that performance tracking can be successful when combined with existing tools. Operators use the BAS to trend key performance indicators such as pressure, temperature, and equipment on/off status, and look for anomalies. The BAS provides real-time alarms to indicate when operation is abnormal, and is subsequently used to find the root cause. ■■ ■■ ■■ Clear goals Time and resources to utilize tools, analyze identified issues, and perform corrective action Sufficient training on tool capabilities Incorporate energy performance metrics in management reporting Communication among stakeholders Support from facility managers, building operators, financial decision-makers and senior management Direct digital controls and building-level energy meters IT support and server storage Lessons Learned The lessons learned implementing an EIS at UC Davis are widely applicable to organizations with similar objectives. ■■ ■■ Strong communication pathways are critical. UC Davis identified an IT firewall issue that limited Building Maintenance access to the EIS data. “We’re making tremendous use of our tools, and we’re only scratching the surface.” Goal-setting is critical to success. Achieving LEED Gold at UC Davis’ new Gallagher Hall has inspired long-term motivation at UC Davis by requiring extensive periods for measurement and verification (M&V). — Chris Cioni Associate Director, Energy Services UC Davis’ ability to engage end-users in monitoring building performance at a large institution exemplifies sound energy management that leverages both people and technology. About this Success Story For more information, contact the CCC at This case study was developed by the California Commissioning Collaborative (CCC) with funding from the California Energy Commission’s Public Interest Energy Research (PIER) program. Email:info@cacx.org Phone:877-306-CACX View more case studies and download a free copy of The Building Performance Tracking Handbook at http://www.cacx.org/PIER/handbook.html


