ECE 405 - TRANSITION TO DIGITAL COMMUNICATION
advertisement
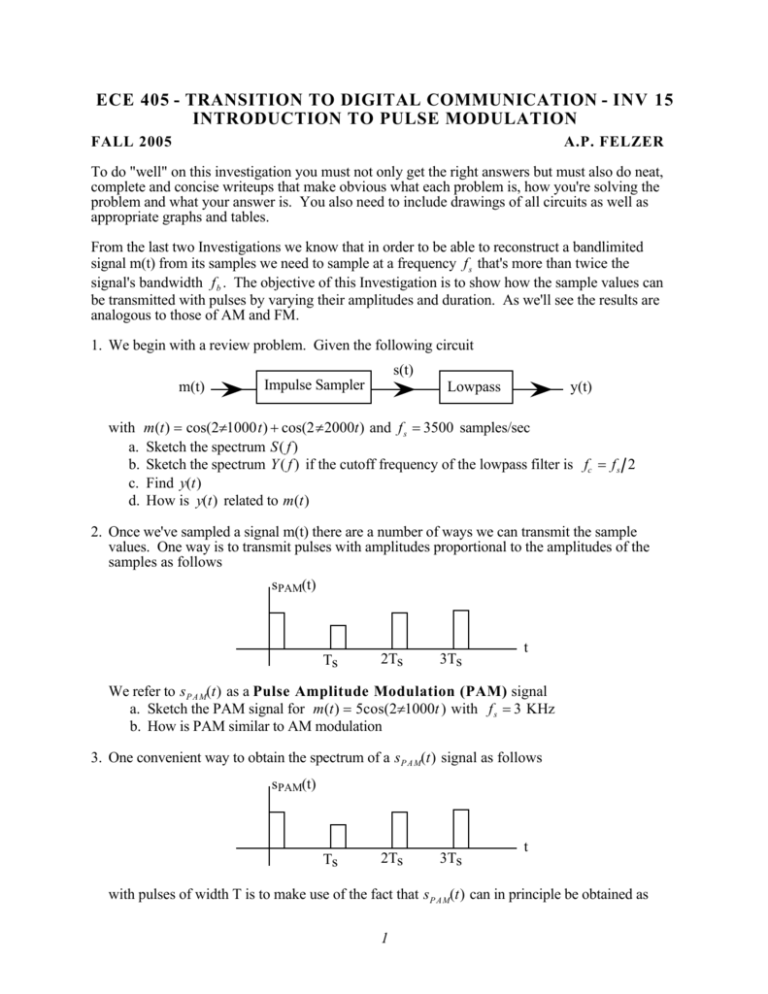
ECE 405 - TRANSITION TO DIGITAL COMMUNICATION - INV 15 INTRODUCTION TO PULSE MODULATION FALL 2005 A.P. FELZER To do "well" on this investigation you must not only get the right answers but must also do neat, complete and concise writeups that make obvious what each problem is, how you're solving the problem and what your answer is. You also need to include drawings of all circuits as well as appropriate graphs and tables. From the last two Investigations we know that in order to be able to reconstruct a bandlimited signal m(t) from its samples we need to sample at a frequency f s that's more than twice the signal's bandwidth f b . The objective of this Investigation is to show how the sample values can be transmitted with pulses by varying their amplitudes and duration. As we'll see the results are analogous to those of AM and FM. 1. We begin with a review problem. Given the following circuit s(t) m(t) Impulse Sampler Lowpass y(t) with m(t) = cos(2π1000t) + cos(2π2000t) and f s = 3500 samples/sec a. Sketch the spectrum S( f ) b. Sketch the spectrum Y ( f ) if the cutoff frequency of the lowpass filter is fc = f s 2 c. Find y(t) d. How is y(t) related to m(t) 2. Once we've sampled a signal m(t) there are a number of ways we can transmit the sample values. One way is to transmit pulses with amplitudes proportional to the amplitudes of the samples as follows sPAM(t) Ts 2Ts 3Ts t We refer to sP A M(t) as a Pulse Amplitude Modulation (PAM) signal a. Sketch the PAM signal for m(t) = 5cos(2π1000t ) with f s = 3 KHz b. How is PAM similar to AM modulation 3. One convenient way to obtain the spectrum of a sP A M(t) signal as follows sPAM(t) Ts 2Ts 3Ts t with pulses of width T is to make use of the fact that sP A M(t) can in principle be obtained as 1 follows m (t) m(t) sP A M(t) Impulse Sampler N where N is a circuit with impulse response h(t) as follows h(t) 1 t T Let us first see how this model works. Obtain sP A M(t) for m(t) = 5cos(2π1000t ) with a sampling frequency of f s = 5 KHz as follows a. First find and sketch m (t) b. Then make use of your result in part (a) to sketch sP A M(t) 4. The objective of this problem is to make use of the model in Problem (3) to find the spectrum of pulse modulated signals a. First make use of the fact that SP A M( f ) = M ( f )F [h(t)] where F[h(t)] is the transfer function of N to show that SP A M( f ) = T sinc ( f T )e − jπfT M ( f ) b. Now make use of the fact that M ( f ) = F[m (t)] = 1 Ts ∞ ∑ M( f − kf ) s k =−∞ to find SP A M( f ) c. Make use of your result in part (b) to sketch the magnitude of SP A M( f ) as follows SP A M( f ) = ∞ T sinc ( f T ) ∑ M ( f − kfs ) Ts k =−∞ if m(t) has the following spectrum, f s = 500 samples/sec and the PAM pulses are of width T = 1 msec M(f) f d. Describe how SP A M( f ) differs from M ( f ) 2 e. Find and sketch the frequency response of the lowpass filter for recovering m(t) from sP A M(t). f. Describe how your filter's frequency response differs from that of an ideal lowpass. g. Verify that when T < 0.1 Ts then we should be able get away without a lowpass filter that compensates for the distortion caused by the sinc function 5. Another kind of pulse modulation is Pulse Width Modulation (PWM) - also referred to as Pulse Duration Modulation (PDM). In this scheme all the pulses are the same magnitudes but their length varies in proportion to amplitude of the sample. Draw the PWM signal corresponding to the following PAM signal sPAM(t) 2Ts Ts 3Ts t 6. A disadvantage of PWM modulation as introduced in Problem (5) is that we're using a lot of power when the pulses are long. One way to get around this problem is with Pulse Position Modulation (PPM) in which just a narrow pulse is transmitted at the end of each PWM pulse. a. Sketch the PPM signal corresponding to the following PWM signal sPWM(t) t 2Ts Ts 3Ts b. How is PPM modulation similar to phase modulation c. Would you expect it to be easier to demodulate PPM or PAM. Why d. Would you expect PAM or PPM to be more susceptible to additive noise. Why 3

